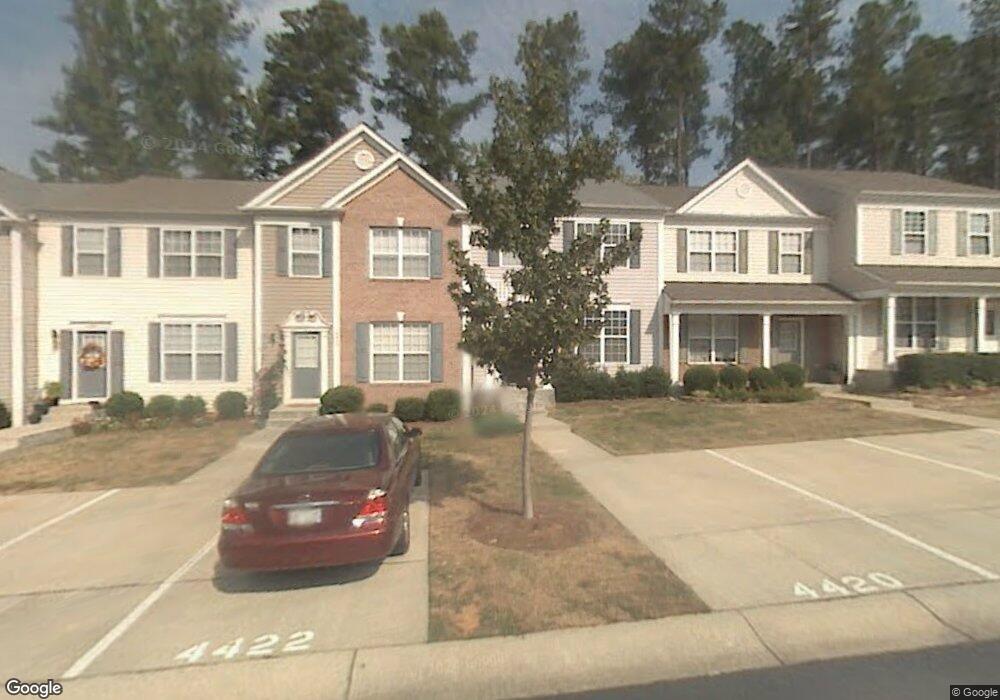
4420 Vienna Crest Dr Raleigh, NC 27613
Northwest Raleigh NeighborhoodEstimated Value: $317,000 - $367,000
3
Beds
3
Baths
1,407
Sq Ft
$238/Sq Ft
Est. Value
About This Home
This home is located at 4420 Vienna Crest Dr, Raleigh, NC 27613 and is currently estimated at $335,381, approximately $238 per square foot. 4420 Vienna Crest Dr is a home located in Wake County with nearby schools including Hilburn Academy, Leesville Road High School, and The Montessori School of Raleigh.
Ownership History
Date
Name
Owned For
Owner Type
Purchase Details
Closed on
Aug 22, 2014
Sold by
Young William Clark and Young Lisa Allen
Bought by
Macc Melissa
Current Estimated Value
Home Financials for this Owner
Home Financials are based on the most recent Mortgage that was taken out on this home.
Original Mortgage
$124,000
Outstanding Balance
$94,867
Interest Rate
4.2%
Mortgage Type
New Conventional
Estimated Equity
$240,514
Purchase Details
Closed on
May 4, 2007
Sold by
Atwater Casey V and Atwater Kristen
Bought by
Young William Clark
Home Financials for this Owner
Home Financials are based on the most recent Mortgage that was taken out on this home.
Original Mortgage
$169,000
Interest Rate
6.1%
Mortgage Type
Unknown
Purchase Details
Closed on
Jun 25, 2002
Sold by
Pulte Home Corp
Bought by
Atwater Casey
Home Financials for this Owner
Home Financials are based on the most recent Mortgage that was taken out on this home.
Original Mortgage
$99,000
Interest Rate
6.77%
Create a Home Valuation Report for This Property
The Home Valuation Report is an in-depth analysis detailing your home's value as well as a comparison with similar homes in the area
Home Values in the Area
Average Home Value in this Area
Purchase History
| Date | Buyer | Sale Price | Title Company |
|---|---|---|---|
| Macc Melissa | $155,000 | None Available | |
| Young William Clark | $169,000 | None Available | |
| Atwater Casey | $129,000 | -- |
Source: Public Records
Mortgage History
| Date | Status | Borrower | Loan Amount |
|---|---|---|---|
| Open | Macc Melissa | $124,000 | |
| Previous Owner | Young William Clark | $169,000 | |
| Previous Owner | Atwater Casey | $99,000 |
Source: Public Records
Tax History Compared to Growth
Tax History
| Year | Tax Paid | Tax Assessment Tax Assessment Total Assessment is a certain percentage of the fair market value that is determined by local assessors to be the total taxable value of land and additions on the property. | Land | Improvement |
|---|---|---|---|---|
| 2025 | $2,851 | $324,591 | $100,000 | $224,591 |
| 2024 | $2,839 | $324,591 | $100,000 | $224,591 |
| 2023 | $2,339 | $212,739 | $45,000 | $167,739 |
| 2022 | $2,174 | $212,739 | $45,000 | $167,739 |
| 2021 | $2,090 | $212,739 | $45,000 | $167,739 |
| 2020 | $2,052 | $212,739 | $45,000 | $167,739 |
| 2019 | $1,831 | $156,259 | $30,000 | $126,259 |
| 2018 | $1,727 | $156,259 | $30,000 | $126,259 |
| 2017 | $1,646 | $156,259 | $30,000 | $126,259 |
| 2016 | $1,612 | $156,259 | $30,000 | $126,259 |
| 2015 | $1,665 | $158,887 | $33,000 | $125,887 |
| 2014 | -- | $158,887 | $33,000 | $125,887 |
Source: Public Records
Map
Nearby Homes
- 7613 Percy Ct
- 6063 Epping Forest Dr
- 6051 Epping Forest Dr
- 6036 Epping Forest Dr
- 502 Plumleaf Rd
- 8713 Little Deer Ln
- 4424 Tetbury Place
- 4536 Hamptonshire Dr
- 3811 Lunceston Way Unit 208
- 4416 Lancashire Dr
- 6736 Hammersmith Dr
- 4541 Hershey Ct
- 4211 Norman Ridge Ln
- 4103 Landfall Ct
- 4104 Betterton Dr
- 6648 Mafolie Ct
- 6408 Shadow Ct
- 5548 Red Robin Rd
- 5145 Landguard Dr
- 5529 Golden Arrow Ln
- 4422 Vienna Crest Dr
- 4418 Vienna Crest Dr
- 4424 Vienna Crest Dr
- 4416 Vienna Crest Dr
- 4426 Vienna Crest Dr
- 4428 Vienna Crest Dr
- 4414 Vienna Crest Dr
- 4430 Vienna Crest Dr
- 4412 Vienna Crest Dr
- 4410 Vienna Crest Dr
- 4509 Pike Rd
- 4417 Vienna Crest Dr
- 4415 Vienna Crest Dr
- 4505 Pike Rd
- 4419 Vienna Crest Dr
- 4421 Vienna Crest Dr
- 4408 Vienna Crest Dr
- 4423 Vienna Crest Dr
- 4425 Vienna Crest Dr
- 4406 Vienna Crest Dr