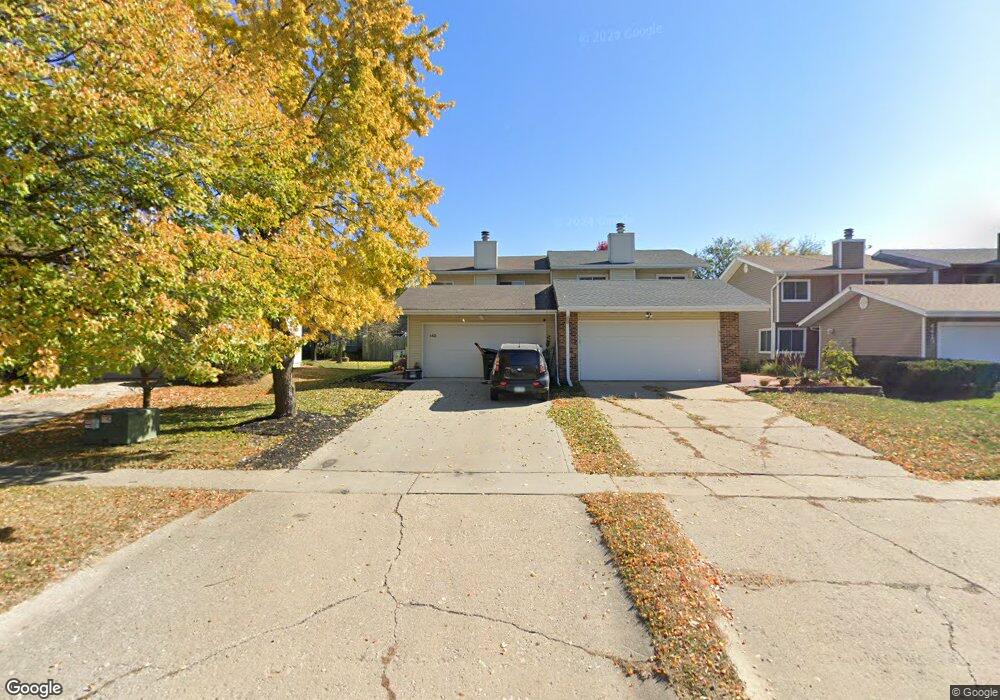
4421 50th St Des Moines, IA 50310
Meredith NeighborhoodEstimated Value: $220,945 - $248,000
--
Bed
2
Baths
1,264
Sq Ft
$183/Sq Ft
Est. Value
About This Home
This home is located at 4421 50th St, Des Moines, IA 50310 and is currently estimated at $231,236, approximately $182 per square foot. 4421 50th St is a home located in Polk County with nearby schools including Lawson Elementary School, Johnston Middle School, and Summit Middle School.
Ownership History
Date
Name
Owned For
Owner Type
Purchase Details
Closed on
Mar 8, 2022
Sold by
Brance Shaw
Bought by
Shaw Brance
Current Estimated Value
Purchase Details
Closed on
Oct 24, 2011
Sold by
Wendl Scott and Wendl Kristin
Bought by
Mkd Properties Llc
Purchase Details
Closed on
Apr 26, 2002
Sold by
Scheel Julie
Bought by
Wendl Scott and Wendl Kristen
Home Financials for this Owner
Home Financials are based on the most recent Mortgage that was taken out on this home.
Original Mortgage
$81,600
Interest Rate
7.25%
Purchase Details
Closed on
Jul 7, 1998
Sold by
Correy Maurice A and Correy Nancy M
Bought by
Scheel Julie
Home Financials for this Owner
Home Financials are based on the most recent Mortgage that was taken out on this home.
Original Mortgage
$83,282
Interest Rate
7.15%
Mortgage Type
FHA
Create a Home Valuation Report for This Property
The Home Valuation Report is an in-depth analysis detailing your home's value as well as a comparison with similar homes in the area
Home Values in the Area
Average Home Value in this Area
Purchase History
| Date | Buyer | Sale Price | Title Company |
|---|---|---|---|
| Shaw Brance | -- | None Listed On Document | |
| Mkd Properties Llc | -- | None Available | |
| Wendl Scott | $83,000 | -- | |
| Scheel Julie | $83,000 | -- |
Source: Public Records
Mortgage History
| Date | Status | Borrower | Loan Amount |
|---|---|---|---|
| Previous Owner | Wendl Scott | $81,600 | |
| Previous Owner | Scheel Julie | $83,282 |
Source: Public Records
Tax History Compared to Growth
Tax History
| Year | Tax Paid | Tax Assessment Tax Assessment Total Assessment is a certain percentage of the fair market value that is determined by local assessors to be the total taxable value of land and additions on the property. | Land | Improvement |
|---|---|---|---|---|
| 2025 | $3,468 | $198,100 | $43,100 | $155,000 |
| 2024 | $3,468 | $179,600 | $38,500 | $141,100 |
| 2023 | $3,538 | $179,600 | $38,500 | $141,100 |
| 2022 | $3,902 | $158,000 | $34,800 | $123,200 |
| 2021 | $3,662 | $158,000 | $34,800 | $123,200 |
| 2020 | $3,596 | $141,300 | $31,300 | $110,000 |
| 2019 | $3,576 | $141,300 | $31,300 | $110,000 |
| 2018 | $3,540 | $133,800 | $29,000 | $104,800 |
| 2017 | $3,352 | $133,800 | $29,000 | $104,800 |
| 2016 | $3,272 | $124,600 | $26,600 | $98,000 |
| 2015 | $3,272 | $124,600 | $26,600 | $98,000 |
| 2014 | $3,122 | $121,400 | $25,500 | $95,900 |
Source: Public Records
Map
Nearby Homes