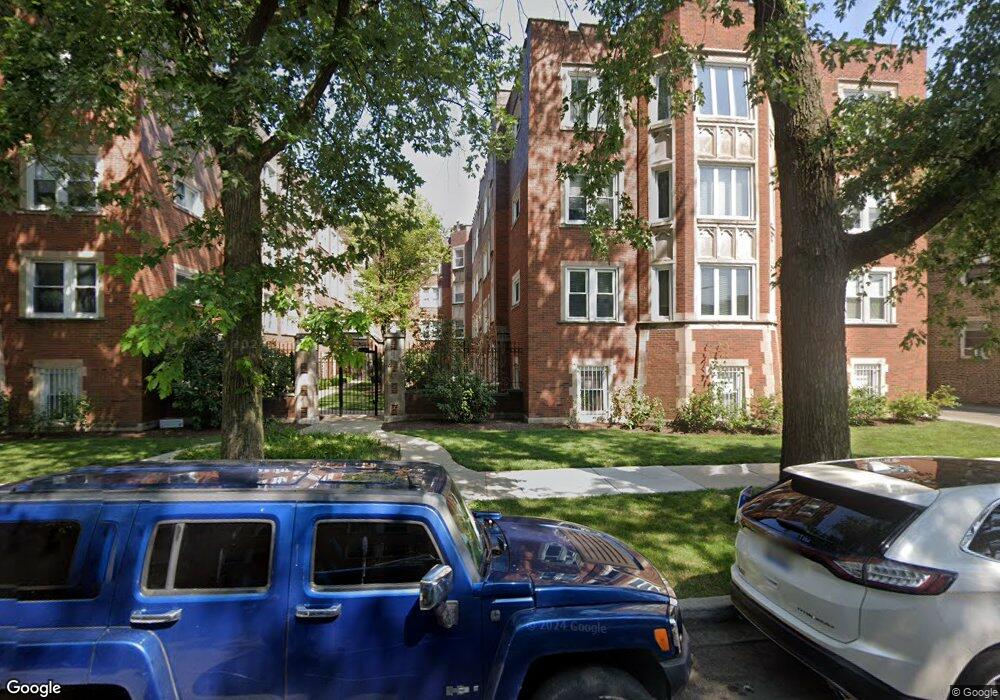
4421 N Lawndale Ave Unit 44212 Chicago, IL 60625
Albany Park NeighborhoodEstimated Value: $229,590 - $281,000
2
Beds
1
Bath
--
Sq Ft
0.36
Acres
About This Home
This home is located at 4421 N Lawndale Ave Unit 44212, Chicago, IL 60625 and is currently estimated at $252,648. 4421 N Lawndale Ave Unit 44212 is a home located in Cook County with nearby schools including Haugan Elementary School, Roosevelt High School, and ASPIRA Haugan Middle School.
Ownership History
Date
Name
Owned For
Owner Type
Purchase Details
Closed on
May 6, 2015
Sold by
Dimberger Daniel and Giesler Carrie
Bought by
Menendez Karla Bonfacia
Current Estimated Value
Home Financials for this Owner
Home Financials are based on the most recent Mortgage that was taken out on this home.
Original Mortgage
$143,400
Interest Rate
3.63%
Mortgage Type
New Conventional
Purchase Details
Closed on
Oct 27, 2003
Sold by
Ripley Timothy and Ripley Natalie
Bought by
Hodel Jennifer
Home Financials for this Owner
Home Financials are based on the most recent Mortgage that was taken out on this home.
Original Mortgage
$165,300
Interest Rate
6.07%
Mortgage Type
Unknown
Purchase Details
Closed on
Sep 19, 2001
Sold by
Chicago Title Land Trust Company
Bought by
Ripley Timothy and Ripley Natalie
Create a Home Valuation Report for This Property
The Home Valuation Report is an in-depth analysis detailing your home's value as well as a comparison with similar homes in the area
Home Values in the Area
Average Home Value in this Area
Purchase History
| Date | Buyer | Sale Price | Title Company |
|---|---|---|---|
| Menendez Karla Bonfacia | $148,000 | None Available | |
| Hodel Jennifer | $174,000 | Atgf Inc | |
| Ripley Timothy | $140,000 | Mercury Title Company |
Source: Public Records
Mortgage History
| Date | Status | Borrower | Loan Amount |
|---|---|---|---|
| Previous Owner | Menendez Karla Bonfacia | $143,400 | |
| Previous Owner | Hodel Jennifer | $165,300 |
Source: Public Records
Tax History Compared to Growth
Tax History
| Year | Tax Paid | Tax Assessment Tax Assessment Total Assessment is a certain percentage of the fair market value that is determined by local assessors to be the total taxable value of land and additions on the property. | Land | Improvement |
|---|---|---|---|---|
| 2024 | $2,474 | $17,326 | $1,645 | $15,681 |
| 2023 | $2,390 | $15,000 | $1,316 | $13,684 |
| 2022 | $2,390 | $15,000 | $1,316 | $13,684 |
| 2021 | $2,354 | $14,999 | $1,315 | $13,684 |
| 2020 | $1,700 | $10,708 | $681 | $10,027 |
| 2019 | $1,728 | $12,000 | $681 | $11,319 |
| 2018 | $1,697 | $12,000 | $681 | $11,319 |
| 2017 | $1,516 | $10,394 | $610 | $9,784 |
| 2016 | $1,587 | $10,394 | $610 | $9,784 |
| 2015 | $1,429 | $10,394 | $610 | $9,784 |
| 2014 | $1,334 | $9,731 | $563 | $9,168 |
| 2013 | $1,296 | $9,731 | $563 | $9,168 |
Source: Public Records
Map
Nearby Homes
- 3733 W Sunnyside Ave
- 3550 W Montrose Ave Unit 107
- 4426 N Drake Ave
- 4304 N Lawndale Ave
- 4515 N Hamlin Ave
- 3707 W Cullom Ave Unit 1
- 3816 W Montrose Ave
- 4249 N Central Park Ave
- 4619 N Lawndale Ave Unit 1
- 4621 N Monticello Ave
- 4534 N Saint Louis Ave
- 4207 N Drake Ave
- 4203 N Drake Ave
- 4416 N Harding Ave Unit 3
- 4322 N Kimball Ave
- 4602 N Springfield Ave
- 4614 N Springfield Ave
- 4143 N Drake Ave
- 4624 N Springfield Ave
- 4115 N Ridgeway Ave
- 4421 N Lawndale Ave Unit 44212
- 4421 N Lawndale Ave Unit 44211
- 4421 N Lawndale Ave Unit 44213
- 4421 N Lawndale Ave Unit 44211
- 4421 N Lawndale Ave Unit 44213
- 4421 N Lawndale Ave Unit 3B
- 4421 N Lawndale Ave Unit 2A
- 4421 N Lawndale Ave Unit 2B
- 4421 N Lawndale Ave Unit 3A
- 4427 N Lawndale Ave Unit 2A
- 4419 N Lawndale Ave Unit 1A
- 4423 N Lawndale Ave Unit 2A
- 4427 N Lawndale Ave Unit 1B
- 4425 N Lawndale Ave Unit 1A
- 4419 N Lawndale Ave Unit 3A
- 4427 N Lawndale Ave Unit 44273
- 4419 N Lawndale Ave Unit 44192
- 4423 N Lawndale Ave Unit 44232
- 4419 N Lawndale Ave Unit 44192
- 4425 N Lawndale Ave Unit 44253