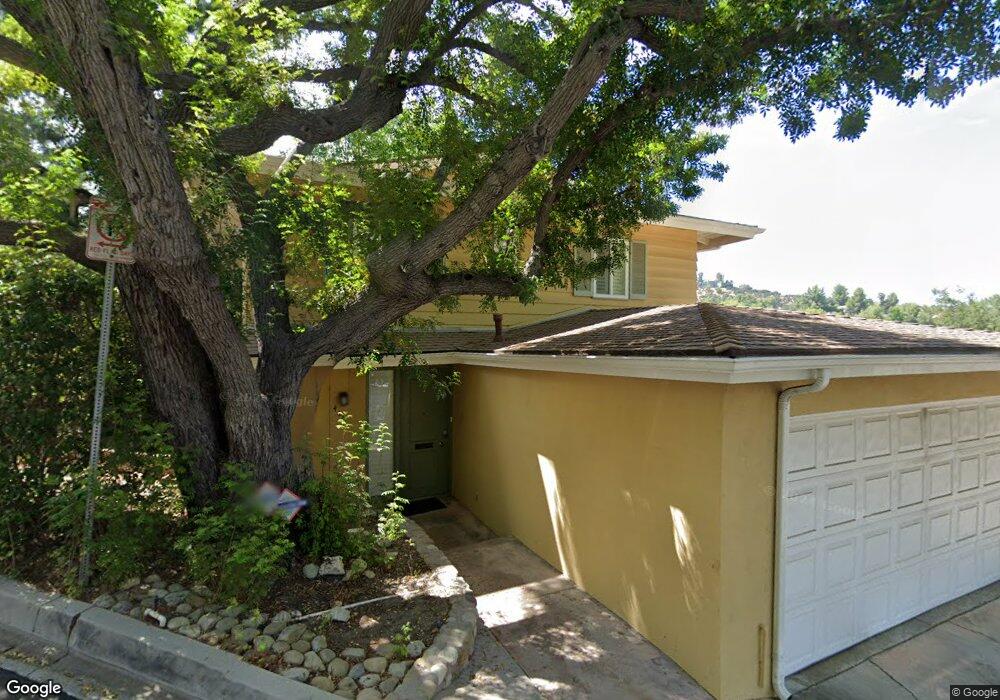
4421 Pampas Rd Woodland Hills, CA 91364
Estimated Value: $1,064,465 - $1,314,000
3
Beds
3
Baths
1,680
Sq Ft
$700/Sq Ft
Est. Value
About This Home
This home is located at 4421 Pampas Rd, Woodland Hills, CA 91364 and is currently estimated at $1,176,116, approximately $700 per square foot. 4421 Pampas Rd is a home located in Los Angeles County with nearby schools including Woodland Hills Academy, Woodland Hills Elementary Charter For Enriched Studies, and Serrania Charter For Enriched Studies.
Ownership History
Date
Name
Owned For
Owner Type
Purchase Details
Closed on
Dec 3, 1998
Sold by
Kapp Gregg H and Kapp Maureen M
Bought by
Weinstein Aaron
Current Estimated Value
Home Financials for this Owner
Home Financials are based on the most recent Mortgage that was taken out on this home.
Original Mortgage
$210,000
Interest Rate
6.82%
Purchase Details
Closed on
Apr 13, 1998
Sold by
Slayton June
Bought by
Slayton Raymond
Home Financials for this Owner
Home Financials are based on the most recent Mortgage that was taken out on this home.
Original Mortgage
$232,750
Interest Rate
7.07%
Purchase Details
Closed on
Dec 28, 1995
Sold by
Bennett David W and Pace Donna J
Bought by
Prosser Oren
Create a Home Valuation Report for This Property
The Home Valuation Report is an in-depth analysis detailing your home's value as well as a comparison with similar homes in the area
Home Values in the Area
Average Home Value in this Area
Purchase History
| Date | Buyer | Sale Price | Title Company |
|---|---|---|---|
| Weinstein Aaron | $282,500 | Progressive Title Company | |
| Slayton Raymond | -- | American Title Co | |
| Slayton Raymond | $245,000 | American Title Co | |
| Kapp Gregg H | -- | Equity Title | |
| Prosser Oren | -- | American Title |
Source: Public Records
Mortgage History
| Date | Status | Borrower | Loan Amount |
|---|---|---|---|
| Previous Owner | Weinstein Aaron | $210,000 | |
| Previous Owner | Slayton Raymond | $232,750 |
Source: Public Records
Tax History Compared to Growth
Tax History
| Year | Tax Paid | Tax Assessment Tax Assessment Total Assessment is a certain percentage of the fair market value that is determined by local assessors to be the total taxable value of land and additions on the property. | Land | Improvement |
|---|---|---|---|---|
| 2025 | $5,400 | $442,855 | $288,136 | $154,719 |
| 2024 | $5,400 | $434,173 | $282,487 | $151,686 |
| 2023 | $5,297 | $425,661 | $276,949 | $148,712 |
| 2022 | $5,071 | $417,316 | $271,519 | $145,797 |
| 2021 | $5,001 | $409,135 | $266,196 | $142,939 |
| 2019 | $4,852 | $397,001 | $258,301 | $138,700 |
| 2018 | $4,817 | $389,218 | $253,237 | $135,981 |
| 2016 | $4,577 | $374,105 | $243,404 | $130,701 |
| 2015 | $4,511 | $368,486 | $239,748 | $128,738 |
| 2014 | $4,530 | $361,269 | $235,052 | $126,217 |
Source: Public Records
Map
Nearby Homes
- 4314 Canoga Dr
- 4630 Esparto St
- 21478 Iglesia Dr
- 4704 Galendo St
- 4710 Galendo St
- 4601 Ensenada Dr
- 4718 Galendo St
- 4459 Ensenada Dr
- 4525 Ensenada Dr
- 21433 Iglesia Dr
- 4401 Cezanne Ave
- 4348 Topanga Canyon Blvd
- 4642 Santa Lucia Dr
- 4328 Torreon Dr
- 4825 Galendo St
- 4731 Topanga Canyon Blvd
- 4237 Golondrina Place
- 4862 Galendo St
- 4377 Saltillo St
- 22051 Mulholland Way
- 4409 Pampas Rd
- 4531 Argentine Rd
- 4410 Pampas Rd
- 4534 Argentine Rd
- 4536 Argentine Rd
- 4521 Argentine Rd
- 4401 Pampas Rd
- 4428 Pampas Rd
- 4400 Pampas Rd
- 4435 Pampas Rd
- 4654 Galendo St
- 4353 Pampas Rd
- 4359 Pampas Rd
- 4512 Argentine Rd
- 4630 Galendo St
- 4511 Argentine Rd
- 4662 Galendo St
- 4391 Pampas Rd
- 4347 Pampas Rd
- 4443 Pampas Rd