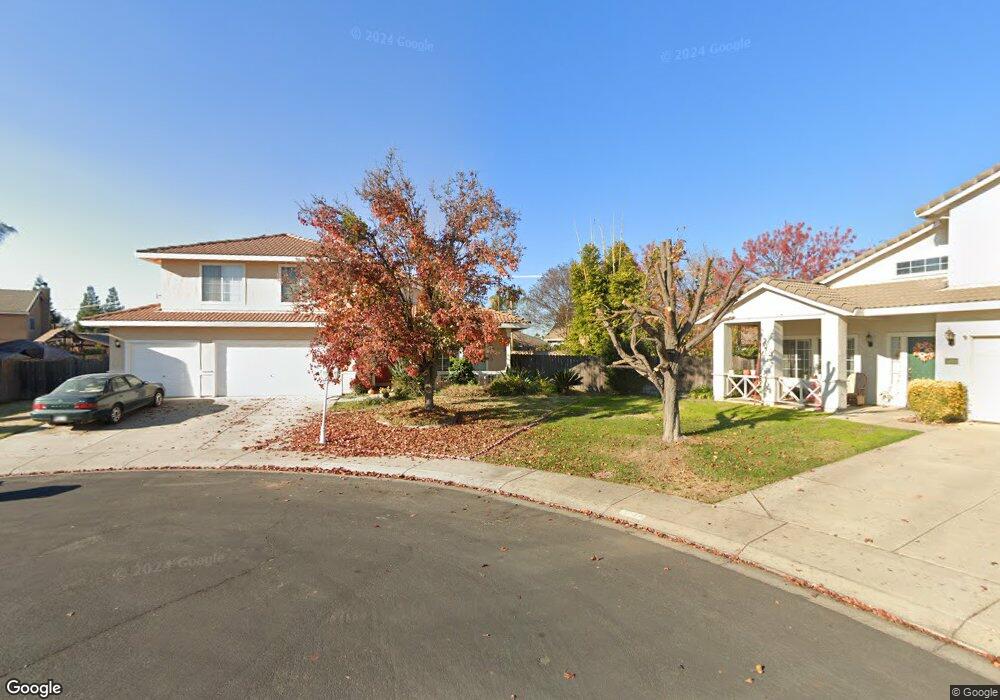
4421 Peridot Ct Salida, CA 95368
Estimated Value: $495,000 - $663,000
4
Beds
2
Baths
2,335
Sq Ft
$246/Sq Ft
Est. Value
About This Home
This home is located at 4421 Peridot Ct, Salida, CA 95368 and is currently estimated at $573,360, approximately $245 per square foot. 4421 Peridot Ct is a home located in Stanislaus County with nearby schools including Dena Boer Elementary School, Salida Middle School - Vella Campus, and Joseph A. Gregori High School.
Ownership History
Date
Name
Owned For
Owner Type
Purchase Details
Closed on
Feb 20, 2004
Sold by
Nou Chanly Pauline
Bought by
Kea Ry
Current Estimated Value
Home Financials for this Owner
Home Financials are based on the most recent Mortgage that was taken out on this home.
Original Mortgage
$289,000
Outstanding Balance
$133,560
Interest Rate
5.62%
Mortgage Type
New Conventional
Estimated Equity
$439,800
Purchase Details
Closed on
Oct 19, 2002
Sold by
Stevens Riley and Stevens Marjorie Luz
Bought by
Kea Ry and Nou Chanly Pauline
Home Financials for this Owner
Home Financials are based on the most recent Mortgage that was taken out on this home.
Original Mortgage
$271,700
Interest Rate
5.88%
Purchase Details
Closed on
Dec 14, 1999
Sold by
Anderson Homes
Bought by
Stevens Riley and Stevens Marjorie Luz
Home Financials for this Owner
Home Financials are based on the most recent Mortgage that was taken out on this home.
Original Mortgage
$171,500
Interest Rate
9.12%
Create a Home Valuation Report for This Property
The Home Valuation Report is an in-depth analysis detailing your home's value as well as a comparison with similar homes in the area
Home Values in the Area
Average Home Value in this Area
Purchase History
| Date | Buyer | Sale Price | Title Company |
|---|---|---|---|
| Kea Ry | -- | Chicago Title | |
| Kea Ry | $286,000 | Alliance Title Company | |
| Stevens Riley | $214,500 | First American Title Co |
Source: Public Records
Mortgage History
| Date | Status | Borrower | Loan Amount |
|---|---|---|---|
| Open | Kea Ry | $289,000 | |
| Closed | Kea Ry | $271,700 | |
| Previous Owner | Stevens Riley | $171,500 |
Source: Public Records
Tax History Compared to Growth
Tax History
| Year | Tax Paid | Tax Assessment Tax Assessment Total Assessment is a certain percentage of the fair market value that is determined by local assessors to be the total taxable value of land and additions on the property. | Land | Improvement |
|---|---|---|---|---|
| 2025 | $6,498 | $414,202 | $99,923 | $314,279 |
| 2024 | $6,386 | $406,081 | $97,964 | $308,117 |
| 2023 | $6,282 | $398,120 | $96,044 | $302,076 |
| 2022 | $6,056 | $390,314 | $94,161 | $296,153 |
| 2021 | $5,976 | $382,662 | $92,315 | $290,347 |
| 2020 | $5,760 | $378,739 | $91,369 | $287,370 |
| 2019 | $5,694 | $371,314 | $89,578 | $281,736 |
| 2018 | $5,689 | $364,034 | $87,822 | $276,212 |
| 2017 | $5,580 | $356,897 | $86,100 | $270,797 |
| 2016 | $5,484 | $349,900 | $84,412 | $265,488 |
| 2015 | $5,171 | $321,000 | $43,000 | $278,000 |
| 2014 | $4,917 | $297,000 | $40,000 | $257,000 |
Source: Public Records
Map
Nearby Homes
- 5428 Ratto Way
- 5208 San Tropez Dr
- 4532 Fallbrook Place
- 5333 Maximillian Dr
- 5112 San Felice Dr
- 5509 Pountsmonth Dr
- 4213 Killigrew Dr
- 5048 Driftwood Dr
- 4431 Sequoia St
- 4900 Wild Rose Dr
- 4825 White Willow Rd
- 4624 Flint Ave
- 5100 Kiernan Ave
- 4736 Carlson Way
- 0 Finney Rd
- 4128 Kincaid Ln
- 4800 Littleton Way
- 5220 Cimarron Ct
- 5228 Firenza Way
- 5313 Corvo Way
- 4417 Peridot Ct
- 4420 Peridot Ct
- 4416 Diamond Ct
- 4420 Diamond Ct
- 4413 Peridot Ct
- 5413 Covert Rd
- 5417 Covert Rd
- 4416 Peridot Ct
- 5409 Covert Rd
- 5421 Covert Rd
- 4412 Diamond Ct
- 5405 Covert Rd
- 4412 Peridot Ct
- 4409 Peridot Ct
- 5425 Covert Rd
- 4421 Citrine Ct
- 4408 Diamond Ct
- 4421 Diamond Ct
- 4417 Citrine Ct
- 5401 Covert Rd