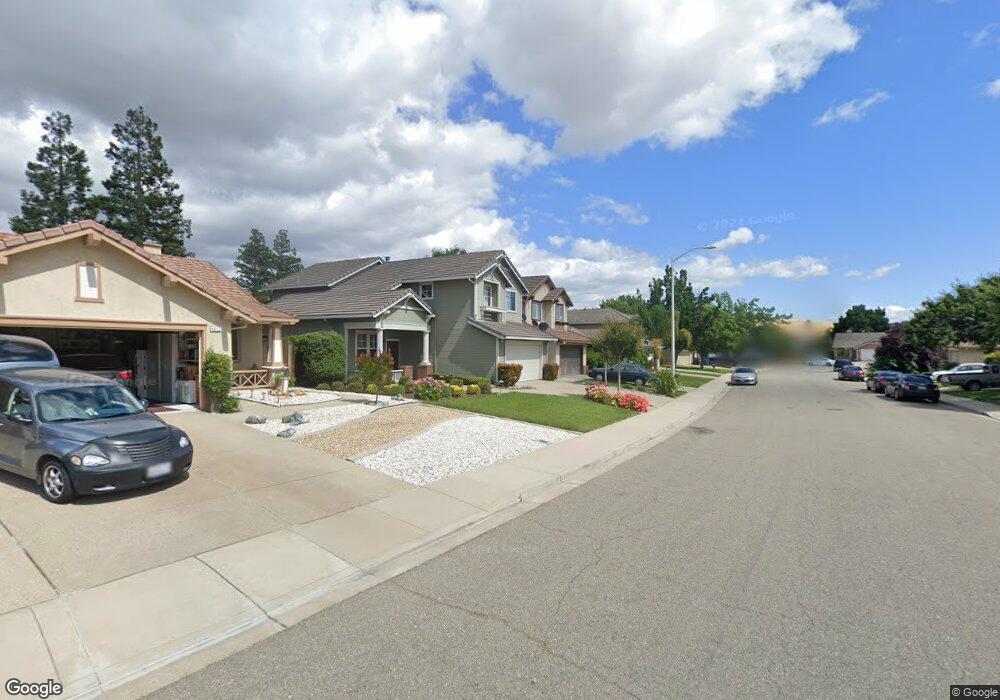
4421 Whitehoof Way Antioch, CA 94531
Deer Valley NeighborhoodEstimated Value: $534,000 - $643,000
3
Beds
3
Baths
1,508
Sq Ft
$386/Sq Ft
Est. Value
About This Home
This home is located at 4421 Whitehoof Way, Antioch, CA 94531 and is currently estimated at $582,414, approximately $386 per square foot. 4421 Whitehoof Way is a home located in Contra Costa County with nearby schools including Jack London Elementary School, Black Diamond Middle School, and Deer Valley High School.
Ownership History
Date
Name
Owned For
Owner Type
Purchase Details
Closed on
Feb 26, 2018
Sold by
Anaya Luis Robles and Rubio Maria
Bought by
Anaya Luis Robles and Rubio Maria
Current Estimated Value
Home Financials for this Owner
Home Financials are based on the most recent Mortgage that was taken out on this home.
Original Mortgage
$27,000
Outstanding Balance
$21,522
Interest Rate
4.04%
Mortgage Type
Credit Line Revolving
Estimated Equity
$560,892
Purchase Details
Closed on
Feb 25, 2008
Sold by
Avelo Mortgage
Bought by
Robles Luis and Rubio Maria
Home Financials for this Owner
Home Financials are based on the most recent Mortgage that was taken out on this home.
Original Mortgage
$273,000
Outstanding Balance
$167,042
Interest Rate
5.41%
Mortgage Type
Purchase Money Mortgage
Estimated Equity
$415,373
Purchase Details
Closed on
Aug 30, 2007
Sold by
Turner Bridgett D
Bought by
Avelo Mortgage Llc
Purchase Details
Closed on
Nov 1, 2006
Sold by
Golden Felix L
Bought by
Turner Bridgett D
Home Financials for this Owner
Home Financials are based on the most recent Mortgage that was taken out on this home.
Original Mortgage
$428,000
Interest Rate
7.25%
Mortgage Type
Purchase Money Mortgage
Purchase Details
Closed on
Sep 2, 2005
Sold by
Ganter Jimmy L
Bought by
Golden Felix L
Home Financials for this Owner
Home Financials are based on the most recent Mortgage that was taken out on this home.
Original Mortgage
$380,000
Interest Rate
5.7%
Mortgage Type
Fannie Mae Freddie Mac
Purchase Details
Closed on
Aug 4, 2004
Sold by
Dinicola Maurice V
Bought by
Ganter Jimmy L
Home Financials for this Owner
Home Financials are based on the most recent Mortgage that was taken out on this home.
Original Mortgage
$338,500
Interest Rate
6.55%
Mortgage Type
Purchase Money Mortgage
Purchase Details
Closed on
Sep 29, 2002
Sold by
Joe Charles D and Joe Pauline S
Bought by
Dinicola Maurice V
Home Financials for this Owner
Home Financials are based on the most recent Mortgage that was taken out on this home.
Original Mortgage
$279,000
Interest Rate
5%
Mortgage Type
Purchase Money Mortgage
Purchase Details
Closed on
May 20, 1994
Sold by
Greystone Homes Inc
Bought by
Joe Charles D and Joe Pauline S
Home Financials for this Owner
Home Financials are based on the most recent Mortgage that was taken out on this home.
Original Mortgage
$168,662
Interest Rate
8.3%
Mortgage Type
Assumption
Create a Home Valuation Report for This Property
The Home Valuation Report is an in-depth analysis detailing your home's value as well as a comparison with similar homes in the area
Home Values in the Area
Average Home Value in this Area
Purchase History
| Date | Buyer | Sale Price | Title Company |
|---|---|---|---|
| Anaya Luis Robles | -- | Accommodation | |
| Robles Luis | $273,000 | Chicago Title Company | |
| Avelo Mortgage Llc | $309,000 | Accommodation | |
| Turner Bridgett D | $535,000 | Alliance Title Company | |
| Golden Felix L | $475,000 | Alliance Title Company | |
| Ganter Jimmy L | -- | Alliance Title Company | |
| Ganter Jimmy L | $350,000 | Alliance Title Company | |
| Dinicola Maurice V | $300,000 | Placer Title | |
| Joe Charles D | $164,000 | First American Title Guarant |
Source: Public Records
Mortgage History
| Date | Status | Borrower | Loan Amount |
|---|---|---|---|
| Open | Anaya Luis Robles | $27,000 | |
| Open | Robles Luis | $273,000 | |
| Previous Owner | Turner Bridgett D | $428,000 | |
| Previous Owner | Golden Felix L | $380,000 | |
| Previous Owner | Ganter Jimmy L | $338,500 | |
| Previous Owner | Dinicola Maurice V | $279,000 | |
| Previous Owner | Joe Charles D | $168,662 |
Source: Public Records
Tax History Compared to Growth
Tax History
| Year | Tax Paid | Tax Assessment Tax Assessment Total Assessment is a certain percentage of the fair market value that is determined by local assessors to be the total taxable value of land and additions on the property. | Land | Improvement |
|---|---|---|---|---|
| 2025 | $4,367 | $358,574 | $131,343 | $227,231 |
| 2024 | $4,367 | $351,544 | $128,768 | $222,776 |
| 2023 | $4,213 | $344,652 | $126,244 | $218,408 |
| 2022 | $4,151 | $337,895 | $123,769 | $214,126 |
| 2021 | $4,030 | $331,271 | $121,343 | $209,928 |
| 2019 | $3,935 | $321,447 | $117,745 | $203,702 |
| 2018 | $3,791 | $315,145 | $115,437 | $199,708 |
| 2017 | $3,713 | $308,967 | $113,174 | $195,793 |
| 2016 | $3,621 | $302,909 | $110,955 | $191,954 |
| 2015 | $3,799 | $298,360 | $109,289 | $189,071 |
| 2014 | $4,115 | $292,517 | $107,149 | $185,368 |
Source: Public Records
Map
Nearby Homes
- 2404 Whitetail Dr
- 4522 Rock Island Dr
- 4529 Pronghorn Way
- 4437 Buckskin Dr
- 4528 Fallow Way
- 2508 Larch Way
- 4305 Calsite Ct
- 2101 Asilomar Dr
- 4101 Galenez Way
- 2640 Point Andrus Ct
- 2705 Asilomar Dr
- 2117 Mark Twain Dr
- 2201 Mark Twain Dr
- 2205 Mark Twain Dr
- 4632 Country Hills Dr
- 4204 Limestone Dr
- 4420 Wolverine Way
- 4437 Deerfield Dr
- 2003 Barkwood Ct
- 4008 Galenez Way
- 4417 Whitehoof Way
- 4425 Whitehoof Way
- 2500 Blacktail Ct
- 4429 Whitehoof Way
- 4413 Whitehoof Way
- 4433 Whitehoof Way
- 2504 Blacktail Ct
- 4409 Whitehoof Way
- 2501 Blacktail Ct
- 4424 Whitehoof Way
- 4420 Whitehoof Way
- 4428 Whitehoof Way
- 4416 Whitehoof Way
- 4405 Whitehoof Way Unit A
- 4432 Whitehoof Way
- 4437 Whitehoof Way
- 2501 Hooftrail Way
- 4412 Whitehoof Way
- 2508 Blacktail Ct
- 4436 Whitehoof Way