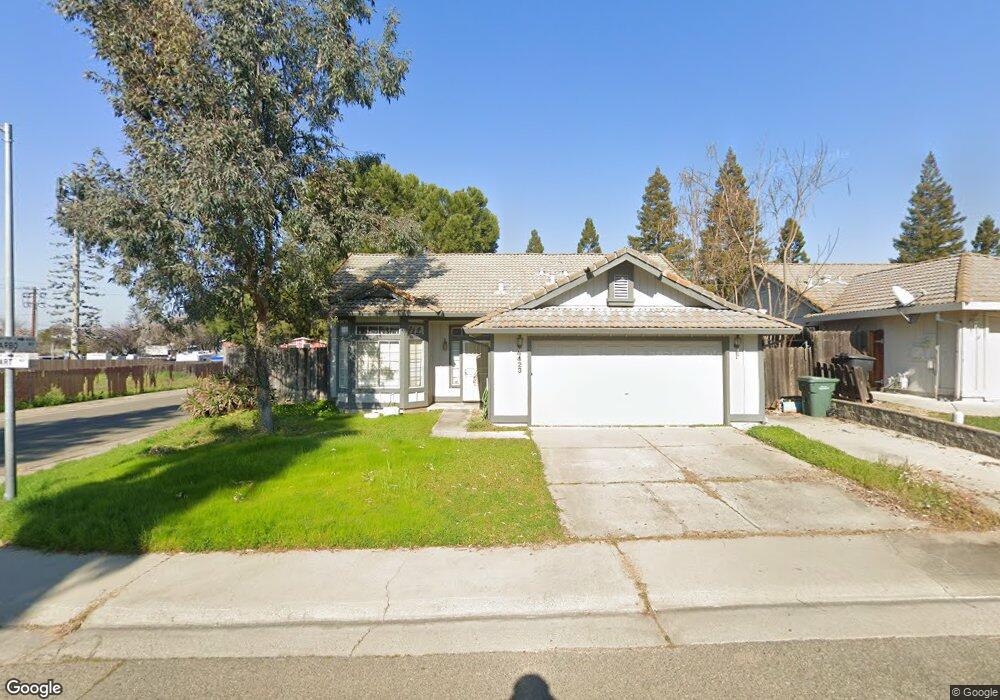
4423 Bogart Way Antelope, CA 95843
Estimated Value: $332,000 - $489,000
3
Beds
2
Baths
1,393
Sq Ft
$317/Sq Ft
Est. Value
About This Home
This home is located at 4423 Bogart Way, Antelope, CA 95843 and is currently estimated at $441,710, approximately $317 per square foot. 4423 Bogart Way is a home located in Sacramento County with nearby schools including Barrett Ranch Elementary School, Antelope Crossing Middle School, and Antelope High School.
Ownership History
Date
Name
Owned For
Owner Type
Purchase Details
Closed on
May 11, 2010
Sold by
Sushko Igor and Sushko Liya
Bought by
Romero Marion L
Current Estimated Value
Home Financials for this Owner
Home Financials are based on the most recent Mortgage that was taken out on this home.
Original Mortgage
$167,741
Outstanding Balance
$112,815
Interest Rate
5.12%
Mortgage Type
FHA
Estimated Equity
$328,895
Purchase Details
Closed on
Dec 21, 2004
Sold by
Hart James R
Bought by
Sushko Igor and Sushko Liya
Home Financials for this Owner
Home Financials are based on the most recent Mortgage that was taken out on this home.
Original Mortgage
$257,200
Interest Rate
1%
Mortgage Type
Negative Amortization
Purchase Details
Closed on
Jul 1, 2002
Sold by
Kawamoto Genshiro
Bought by
Hart James R
Home Financials for this Owner
Home Financials are based on the most recent Mortgage that was taken out on this home.
Original Mortgage
$171,275
Interest Rate
6.6%
Create a Home Valuation Report for This Property
The Home Valuation Report is an in-depth analysis detailing your home's value as well as a comparison with similar homes in the area
Home Values in the Area
Average Home Value in this Area
Purchase History
| Date | Buyer | Sale Price | Title Company |
|---|---|---|---|
| Romero Marion L | $170,000 | Fidelity National Title Co | |
| Sushko Igor | $321,500 | Commonwealth | |
| Hart James R | $201,500 | Fidelity National Title Co |
Source: Public Records
Mortgage History
| Date | Status | Borrower | Loan Amount |
|---|---|---|---|
| Open | Romero Marion L | $167,741 | |
| Previous Owner | Sushko Igor | $257,200 | |
| Previous Owner | Hart James R | $171,275 | |
| Closed | Sushko Igor | $32,150 |
Source: Public Records
Tax History Compared to Growth
Tax History
| Year | Tax Paid | Tax Assessment Tax Assessment Total Assessment is a certain percentage of the fair market value that is determined by local assessors to be the total taxable value of land and additions on the property. | Land | Improvement |
|---|---|---|---|---|
| 2025 | $5,805 | $219,423 | $96,803 | $122,620 |
| 2024 | $5,805 | $215,121 | $94,905 | $120,216 |
| 2023 | $5,778 | $210,904 | $93,045 | $117,859 |
| 2022 | $5,780 | $206,770 | $91,221 | $115,549 |
| 2021 | $2,336 | $202,717 | $89,433 | $113,284 |
| 2020 | $2,317 | $200,639 | $88,516 | $112,123 |
| 2019 | $2,284 | $196,706 | $86,781 | $109,925 |
| 2018 | $2,203 | $192,850 | $85,080 | $107,770 |
| 2017 | $2,171 | $189,069 | $83,412 | $105,657 |
| 2016 | $2,115 | $185,363 | $81,777 | $103,586 |
| 2015 | $2,078 | $182,580 | $80,549 | $102,031 |
| 2014 | $2,043 | $179,005 | $78,972 | $100,033 |
Source: Public Records
Map
Nearby Homes
- 7761 Megan Ann Way
- 7805 Megan Ann Ct
- 7813 Megan Ann Ct
- 7949 Ivy Hill Way
- 7600 Antelope Hills Dr
- 4104 Crumley Way
- 7327 Salazar Dr
- 3937 Running Bear Way
- 8020 Walerga Rd Unit 1061
- 8020 Walerga Rd Unit 1024
- 8020 Walerga Rd Unit 3
- 4234 N Country Dr
- 723 Peabody Ct
- 7953 Pearl Drop Ct
- 3812 Blackfoot Way
- 7531 Event Way
- 7329 Monogram Dr
- 7929 Eagle Peak Way
- 7535 Event Way
- 3675 Misty Lake Dr
- 4427 Bogart Way
- 4436 Garbo Way
- 4440 Garbo Way
- 4431 Bogart Way
- 4424 Bogart Way
- 4420 Bogart Way
- 4444 Garbo Way
- 4428 Bogart Way
- 4435 Bogart Way
- 4432 Bogart Way
- 4448 Garbo Way
- 4419 Garbo Way
- 4439 Bogart Way
- 4436 Bogart Way
- 4437 Garbo Way
- 7637 Orpheum Way
- 4423 Garbo Way
- 7633 Orpheum Way
- 4441 Garbo Way
- 4452 Garbo Way