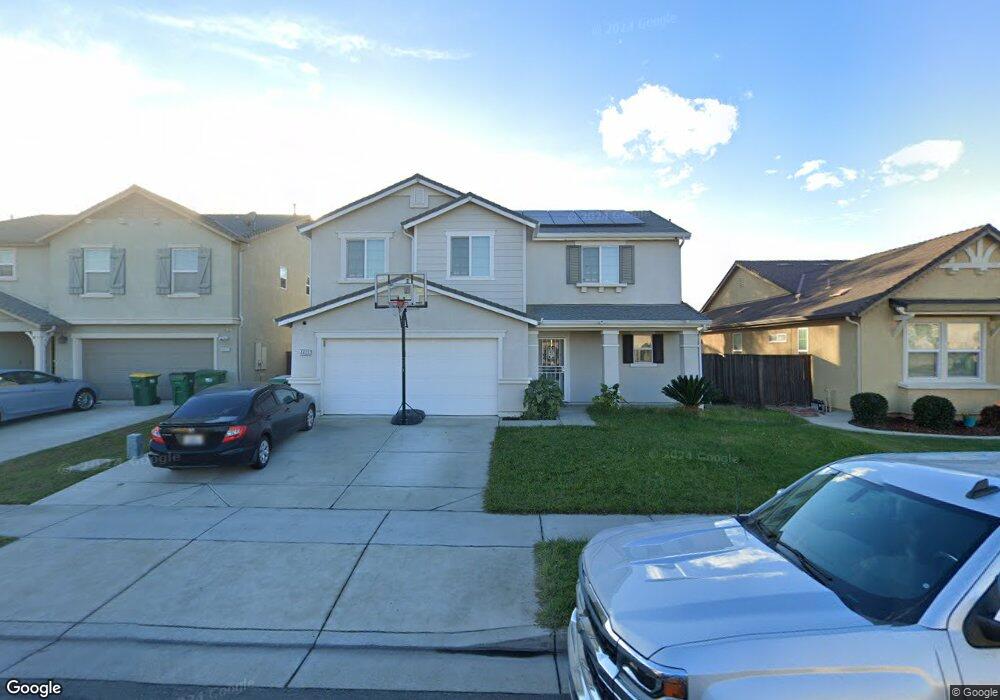
4423 Foxcatcher Way Unit 3 Stockton, CA 95212
Estimated Value: $241,000 - $523,000
4
Beds
3
Baths
1,899
Sq Ft
$236/Sq Ft
Est. Value
About This Home
This home is located at 4423 Foxcatcher Way Unit 3, Stockton, CA 95212 and is currently estimated at $448,096, approximately $235 per square foot. 4423 Foxcatcher Way Unit 3 is a home located in San Joaquin County with nearby schools including Valentine Peyton Elementary School, George W. Bush Elementary School, and Rio Calaveras Elementary School.
Ownership History
Date
Name
Owned For
Owner Type
Purchase Details
Closed on
Oct 29, 2018
Sold by
Phongsavanh Nieva
Bought by
Nieva Phongsavanh and Manythong Jennifer
Current Estimated Value
Home Financials for this Owner
Home Financials are based on the most recent Mortgage that was taken out on this home.
Original Mortgage
$296,000
Outstanding Balance
$260,799
Interest Rate
4.9%
Mortgage Type
New Conventional
Estimated Equity
$187,297
Purchase Details
Closed on
Jun 20, 2014
Sold by
Manythong Jennifer and Phongsavanh Nieva
Bought by
Phongsavanh Nieva
Home Financials for this Owner
Home Financials are based on the most recent Mortgage that was taken out on this home.
Original Mortgage
$200,000
Interest Rate
4.17%
Mortgage Type
New Conventional
Purchase Details
Closed on
Feb 11, 2011
Sold by
Kb Home Sacramento Inc
Bought by
Phongsavanh Nieva
Home Financials for this Owner
Home Financials are based on the most recent Mortgage that was taken out on this home.
Original Mortgage
$195,904
Interest Rate
4.5%
Mortgage Type
FHA
Create a Home Valuation Report for This Property
The Home Valuation Report is an in-depth analysis detailing your home's value as well as a comparison with similar homes in the area
Home Values in the Area
Average Home Value in this Area
Purchase History
| Date | Buyer | Sale Price | Title Company |
|---|---|---|---|
| Nieva Phongsavanh | -- | Placer Title Company | |
| Phongsavanh Nieva | -- | Fidelity National Title Co | |
| Phongsavanh Nieva | $201,000 | First American Title Company |
Source: Public Records
Mortgage History
| Date | Status | Borrower | Loan Amount |
|---|---|---|---|
| Open | Nieva Phongsavanh | $296,000 | |
| Closed | Phongsavanh Nieva | $200,000 | |
| Previous Owner | Phongsavanh Nieva | $195,904 |
Source: Public Records
Tax History Compared to Growth
Tax History
| Year | Tax Paid | Tax Assessment Tax Assessment Total Assessment is a certain percentage of the fair market value that is determined by local assessors to be the total taxable value of land and additions on the property. | Land | Improvement |
|---|---|---|---|---|
| 2025 | $4,161 | $279,813 | $64,053 | $215,760 |
| 2024 | $3,975 | $274,328 | $62,798 | $211,530 |
| 2023 | $3,895 | $268,950 | $61,567 | $207,383 |
| 2022 | $3,848 | $263,677 | $60,360 | $203,317 |
| 2021 | $3,709 | $258,508 | $59,177 | $199,331 |
| 2020 | $3,760 | $255,859 | $58,571 | $197,288 |
| 2019 | $3,756 | $250,843 | $57,423 | $193,420 |
| 2018 | $3,447 | $226,318 | $56,298 | $170,020 |
| 2017 | $3,305 | $221,882 | $55,195 | $166,687 |
| 2016 | $3,515 | $217,533 | $54,113 | $163,420 |
| 2014 | $3,369 | $210,069 | $52,256 | $157,813 |
Source: Public Records
Map
Nearby Homes
- 4437 Harmony Hill Way
- 4503 White Forge Dr
- 2330 Pinetown St
- 4028 Trieste Cir
- 1750 Bonaire Cir
- 2321 Bartram Run Way
- 4705 Cayman Ct
- 2036 Mighty Oak Dr
- 1608 Bonaire Cir
- 2224 Big Oak Ct
- 3605 Gloria Ct
- 1771 Fontanella Way
- 4450 Oakfield Dr
- 3704 San Rafael Ave
- 2709 Etcheverry Dr
- 3515 Carly Dr
- 2312 E Stadium Dr
- 2337 E Alpine Ave
- 2347 E Alpine Ave
- 3611 West Ln
- 4415 Foxcatcher Way
- 4431 Foxcatcher Way Unit 3
- 4439 Foxcatcher Way
- 4407 Foxcatcher Way
- 4410 Harmony Hill Way
- 4418 Harmony Hill Way Unit 3
- 4402 Harmony Hill Way
- 2206 Hayden Brook Dr
- 4426 Harmony Hill Way
- 4337 Foxcatcher Way
- 2203 Bridgeton Way
- 4505 Foxcatcher Way
- 2212 Hayden Brook Dr
- 4434 Harmony Hill Way
- 2215 Bridgeton Way
- 4325 Foxcatcher Way
- 4511 Foxcatcher Way
- 2205 Hayden Brook Dr
- 4516 Harmony Hill Way Unit 3
- 2218 Hayden Brook Dr