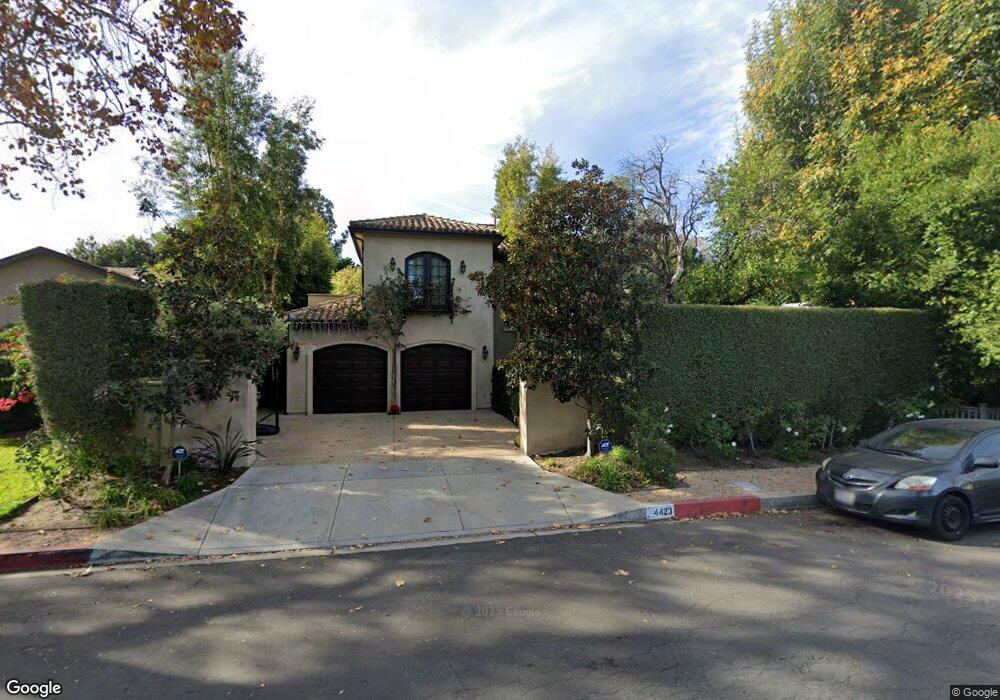
4423 Mammoth Ave Sherman Oaks, CA 91423
Estimated Value: $1,826,000 - $2,755,000
4
Beds
3
Baths
3,166
Sq Ft
$731/Sq Ft
Est. Value
About This Home
This home is located at 4423 Mammoth Ave, Sherman Oaks, CA 91423 and is currently estimated at $2,313,333, approximately $730 per square foot. 4423 Mammoth Ave is a home located in Los Angeles County with nearby schools including Ulysses S. Grant Senior High School, Dixie Canyon Avenue Elementary School, and Riverside Drive Charter Elementary School.
Ownership History
Date
Name
Owned For
Owner Type
Purchase Details
Closed on
Sep 29, 2012
Current Estimated Value
Purchase Details
Closed on
Mar 18, 2010
Purchase Details
Closed on
Jan 9, 2001
Home Financials for this Owner
Home Financials are based on the most recent Mortgage that was taken out on this home.
Original Mortgage
$197,430
Interest Rate
7.06%
Mortgage Type
Seller Take Back
Purchase Details
Closed on
May 15, 1997
Sold by
Norwest Bank Arizona Na
Purchase Details
Closed on
Sep 4, 1996
Sold by
Lipman Zvi and Wexsler Galia
Bought by
Caliber Bank
Purchase Details
Closed on
May 17, 1996
Sold by
Averbuch Hila
Bought by
Klain Iris and Klain Yaron
Purchase Details
Closed on
Apr 13, 1996
Sold by
Averbuch Doron
Bought by
Sharaby Anat and Ammar Eldad
Purchase Details
Closed on
Feb 14, 1996
Sold by
Lipman Zvi
Bought by
Averbuch Doron and Averbuch Hila
Create a Home Valuation Report for This Property
The Home Valuation Report is an in-depth analysis detailing your home's value as well as a comparison with similar homes in the area
Home Values in the Area
Average Home Value in this Area
Purchase History
| Date | Buyer | Sale Price | Title Company |
|---|---|---|---|
| -- | -- | None Available | |
| -- | -- | Accommodation | |
| -- | -- | Fidelity National Title Co | |
| -- | -- | -- | |
| -- | $191,000 | Landsafe Title | |
| Caliber Bank | $190,000 | Landsafe Title | |
| Klain Iris | -- | -- | |
| Sharaby Anat | -- | -- | |
| Averbuch Doron | -- | -- |
Source: Public Records
Mortgage History
| Date | Status | Borrower | Loan Amount |
|---|---|---|---|
| Previous Owner | -- | $197,430 |
Source: Public Records
Tax History Compared to Growth
Tax History
| Year | Tax Paid | Tax Assessment Tax Assessment Total Assessment is a certain percentage of the fair market value that is determined by local assessors to be the total taxable value of land and additions on the property. | Land | Improvement |
|---|---|---|---|---|
| 2025 | $8,598 | $700,785 | $248,853 | $451,932 |
| 2024 | $8,598 | $687,045 | $243,974 | $443,071 |
| 2023 | $8,434 | $673,575 | $239,191 | $434,384 |
| 2022 | $8,047 | $660,368 | $234,501 | $425,867 |
| 2021 | $7,934 | $647,420 | $229,903 | $417,517 |
| 2019 | $7,698 | $628,219 | $223,085 | $405,134 |
| 2018 | $7,597 | $615,902 | $218,711 | $397,191 |
| 2016 | $7,235 | $591,987 | $210,219 | $381,768 |
| 2015 | $7,130 | $576,716 | $207,062 | $369,654 |
| 2014 | $7,082 | $565,419 | $203,006 | $362,413 |
Source: Public Records
Map
Nearby Homes
- 4358 Mammoth Ave Unit 26
- 4477 Woodman Ave Unit 304
- 4321 Matilija Ave Unit 1
- 4321 Matilija Ave Unit 14
- 4405 Ventura Canyon Ave
- 4381 Ventura Canyon Ave Unit 4
- 13920 Moorpark St Unit 201
- 4539 Mammoth Ave
- 36010 Ventura Canyon Ave
- 4334 Colbath Ave Unit 304
- 4454 Ventura Canyon Ave Unit 105
- 4454 Ventura Canyon Ave Unit 304
- 4487 Colbath Ave Unit 101
- 4487 Colbath Ave Unit 207
- 13948 Moorpark St Unit 4
- 13543 Moorpark St Unit 7
- 4545 Allott Ave
- 3724 N Knobhill Dr
- 3732 N Knobhill Dr
- 4546 Allott Ave
- 4413 Mammoth Ave
- 4429 Mammoth Ave
- 4409 Mammoth Ave
- 4433 Mammoth Ave
- 4437 Mammoth Ave
- 4439 Mammoth Ave
- 4422 Matilija Ave
- 4426 Matilija Ave
- 4412 Matilija Ave
- 4414 Mammoth Ave
- 4434 Matilija Ave
- 4410 Matilija Ave
- 4443 Mammoth Ave
- 4445 Mammoth Ave
- 4420 Mammoth Ave
- 4447 Mammoth Ave
- 4428 Mammoth Ave
- 4440 Matilija Ave
- 4420 Matilija Ave
- 4410 Mammoth Ave