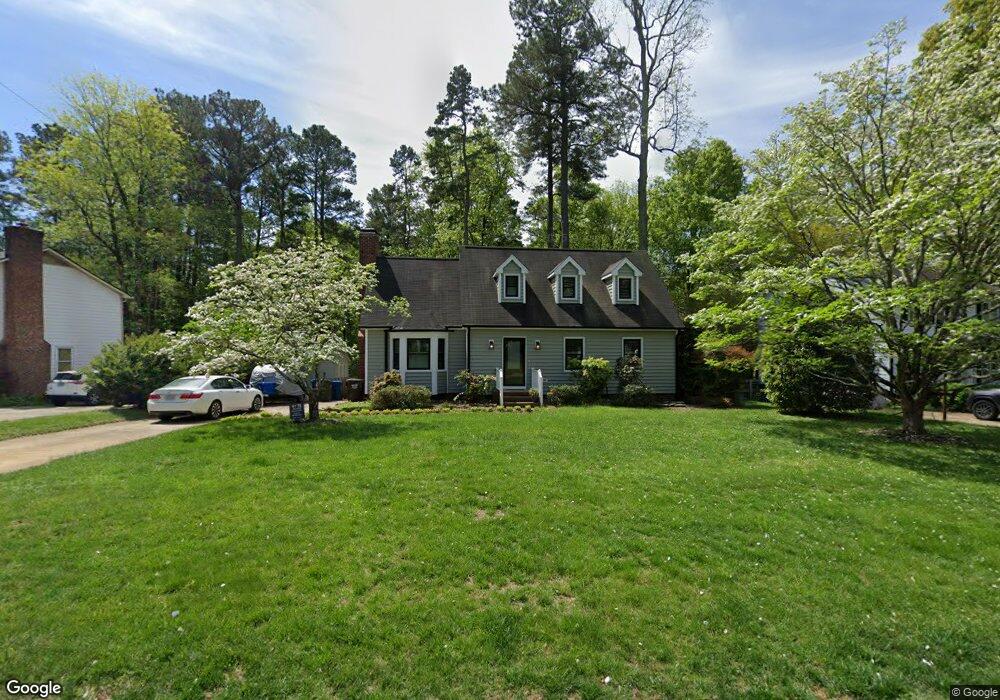
4423 Talcott Dr Durham, NC 27705
West Durham NeighborhoodEstimated Value: $466,000 - $539,000
3
Beds
3
Baths
2,021
Sq Ft
$249/Sq Ft
Est. Value
About This Home
This home is located at 4423 Talcott Dr, Durham, NC 27705 and is currently estimated at $502,725, approximately $248 per square foot. 4423 Talcott Dr is a home located in Durham County with nearby schools including Morehead Montessori, Forest View Elementary, and Brogden Middle.
Ownership History
Date
Name
Owned For
Owner Type
Purchase Details
Closed on
Oct 12, 2015
Sold by
Dusetzina Stacie and Dusetzina Bret
Bought by
Keyser Amy
Current Estimated Value
Purchase Details
Closed on
Mar 1, 2006
Sold by
Green Justin B and Vaughn Carolyn
Bought by
Dusetzina Stacie and Dusetzina Bret
Home Financials for this Owner
Home Financials are based on the most recent Mortgage that was taken out on this home.
Original Mortgage
$164,000
Interest Rate
6.12%
Mortgage Type
Fannie Mae Freddie Mac
Purchase Details
Closed on
Aug 11, 2003
Sold by
Ogilve Norman F and Ogilve Jan Samuelson
Bought by
Green Justin B and Vaughn Carolyn
Home Financials for this Owner
Home Financials are based on the most recent Mortgage that was taken out on this home.
Original Mortgage
$166,500
Interest Rate
5.42%
Mortgage Type
Purchase Money Mortgage
Create a Home Valuation Report for This Property
The Home Valuation Report is an in-depth analysis detailing your home's value as well as a comparison with similar homes in the area
Home Values in the Area
Average Home Value in this Area
Purchase History
| Date | Buyer | Sale Price | Title Company |
|---|---|---|---|
| Keyser Amy | $223,000 | Attorney | |
| Dusetzina Stacie | $205,000 | None Available | |
| Green Justin B | $185,000 | -- |
Source: Public Records
Mortgage History
| Date | Status | Borrower | Loan Amount |
|---|---|---|---|
| Previous Owner | Dusetzina Stacie | $164,000 | |
| Previous Owner | Green Justin B | $166,500 |
Source: Public Records
Tax History
| Year | Tax Paid | Tax Assessment Tax Assessment Total Assessment is a certain percentage of the fair market value that is determined by local assessors to be the total taxable value of land and additions on the property. | Land | Improvement |
|---|---|---|---|---|
| 2025 | $2,962 | $497,977 | $137,700 | $360,277 |
| 2024 | $3,537 | $253,573 | $60,840 | $192,733 |
| 2023 | $3,322 | $253,573 | $60,840 | $192,733 |
| 2022 | $3,245 | $253,573 | $60,840 | $192,733 |
| 2021 | $3,230 | $253,573 | $60,840 | $192,733 |
| 2020 | $3,154 | $253,573 | $60,840 | $192,733 |
| 2019 | $3,154 | $253,573 | $60,840 | $192,733 |
| 2018 | $3,090 | $227,775 | $54,080 | $173,695 |
| 2017 | $3,067 | $227,775 | $54,080 | $173,695 |
| 2016 | $2,964 | $227,775 | $54,080 | $173,695 |
| 2015 | $2,649 | $191,391 | $33,436 | $157,955 |
| 2014 | -- | $191,391 | $33,436 | $157,955 |
Source: Public Records
Map
Nearby Homes
- 4441 Talcott Dr
- 6 Intuition Cir
- 4231 American Dr Unit C
- 112 Mt Evans Dr
- 4111 Talcott Dr
- 708 Constitution Dr Unit F
- 710 Constitution Dr Unit 206
- 710 Constitution Dr Unit A
- 74 Forest Oaks Dr
- 22 Durbin Place
- 19 Providence Ct
- 128 Galway Glenn Ln
- 4 Astor Ct
- 13 Providence Ct
- 50 Galway Glenn Ln
- 1013 Coldspring Cir
- 409 Morreene Rd
- 300 Vincent Ave
- 512 Soapstone Dr
- 516 Soapstone Dr
- 4419 Talcott Dr
- 4427 Talcott Dr
- 7 Virginia Dare Ct
- 4415 Talcott Dr
- 3 Virginia Dare Ct
- 11 Virginia Dare Ct
- 4424 Talcott Dr
- 4409 Talcott Dr
- 4420 Talcott Dr
- 4426 Talcott Dr
- 1 Cauldwell Ln
- 4418 Talcott Dr
- 4430 Talcott Dr
- 13 Virginia Dare Ct
- 4434 Talcott Dr
- 4405 Talcott Dr
- 4437 Talcott Dr
- 4308 Valley Forge Rd
- 4436 Talcott Dr
- 4408 Talcott Dr
Your Personal Tour Guide
Ask me questions while you tour the home.