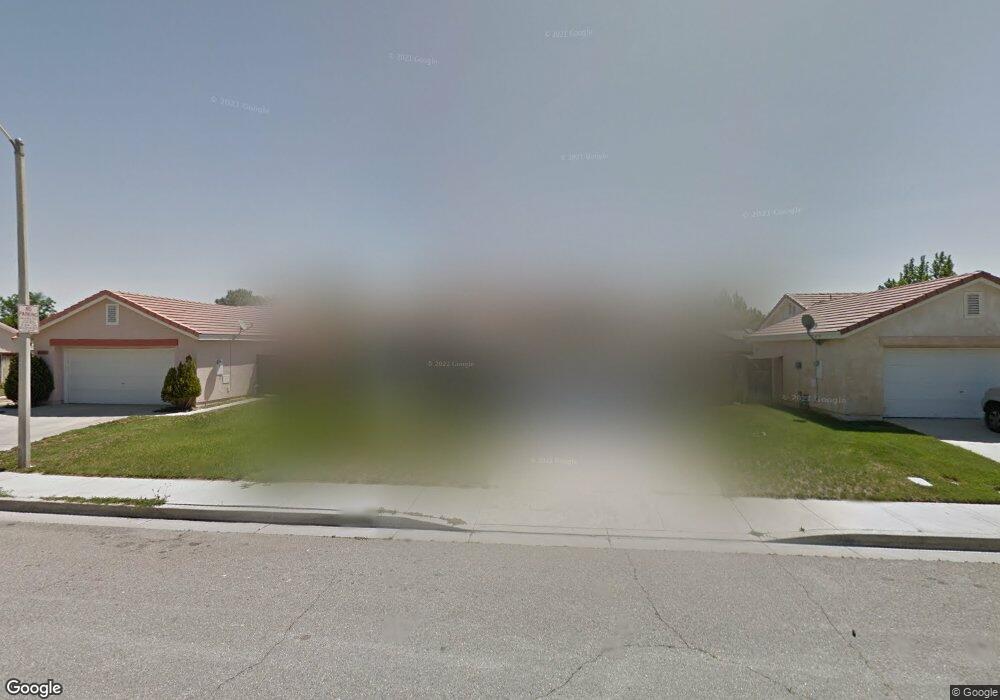
44236 Brandon Thomas Way Lancaster, CA 93536
West Lancaster NeighborhoodEstimated Value: $430,000 - $458,000
3
Beds
2
Baths
1,380
Sq Ft
$318/Sq Ft
Est. Value
About This Home
This home is located at 44236 Brandon Thomas Way, Lancaster, CA 93536 and is currently estimated at $439,412, approximately $318 per square foot. 44236 Brandon Thomas Way is a home located in Los Angeles County with nearby schools including Sundown Elementary School, Quartz Hill High School, and Fabunni Private School Inc..
Ownership History
Date
Name
Owned For
Owner Type
Purchase Details
Closed on
Aug 25, 2003
Sold by
Schlunegger Erin Leanne
Bought by
Schlunegger Robert C
Current Estimated Value
Home Financials for this Owner
Home Financials are based on the most recent Mortgage that was taken out on this home.
Original Mortgage
$117,600
Interest Rate
5.6%
Mortgage Type
Purchase Money Mortgage
Purchase Details
Closed on
Nov 2, 2001
Sold by
Beebe Michael J
Bought by
Schlunegger Robert C
Home Financials for this Owner
Home Financials are based on the most recent Mortgage that was taken out on this home.
Original Mortgage
$119,323
Interest Rate
6.51%
Mortgage Type
FHA
Purchase Details
Closed on
Dec 5, 1995
Sold by
Beebe Michael J and Beebe Sandra S
Bought by
Beebe Michael J
Create a Home Valuation Report for This Property
The Home Valuation Report is an in-depth analysis detailing your home's value as well as a comparison with similar homes in the area
Home Values in the Area
Average Home Value in this Area
Purchase History
| Date | Buyer | Sale Price | Title Company |
|---|---|---|---|
| Schlunegger Robert C | -- | Chicago Title Co | |
| Schlunegger Robert C | $121,500 | Fidelity Title Company | |
| Beebe Michael J | -- | First American |
Source: Public Records
Mortgage History
| Date | Status | Borrower | Loan Amount |
|---|---|---|---|
| Closed | Schlunegger Robert C | $117,600 | |
| Previous Owner | Schlunegger Robert C | $119,323 | |
| Closed | Schlunegger Robert C | $3,636 | |
| Closed | Schlunegger Robert C | $18,300 |
Source: Public Records
Tax History
| Year | Tax Paid | Tax Assessment Tax Assessment Total Assessment is a certain percentage of the fair market value that is determined by local assessors to be the total taxable value of land and additions on the property. | Land | Improvement |
|---|---|---|---|---|
| 2025 | $3,585 | $179,466 | $35,884 | $143,582 |
| 2024 | $3,585 | $175,948 | $35,181 | $140,767 |
| 2023 | $3,539 | $172,499 | $34,492 | $138,007 |
| 2022 | $3,344 | $169,117 | $33,816 | $135,301 |
| 2021 | $2,945 | $165,802 | $33,153 | $132,649 |
| 2019 | $2,873 | $160,886 | $32,171 | $128,715 |
| 2018 | $2,719 | $157,733 | $31,541 | $126,192 |
| 2016 | $2,583 | $151,610 | $30,317 | $121,293 |
| 2015 | $2,555 | $149,334 | $29,862 | $119,472 |
| 2014 | $3,005 | $146,410 | $29,278 | $117,132 |
Source: Public Records
Map
Nearby Homes
- 6157 W Avenue j4
- 44241 Tahoe Way
- 6144 Treehaven Ct
- 3626 W Avenue J 2
- 44238 Encanto Way
- 44220 Encanto Way
- 60 W Avenue J-4
- 0 61st St W
- 60 Stw Vic Ave
- 44460 Encanto Way
- 5818 W Avenue J
- 44335 57th St W
- 6135 W Avenue J 9
- 0 56th West & J3
- 0 65th St West and J8 Unit 25002929
- 6223 W Avenue j12
- 0 St
- 8500 W Avenue J
- 43838 Madison Ct
- 6147 W Avenue j15
- 44230 Brandon Thomas Way
- 6069 W Avenue j3
- 44248 Brandon Thomas Way
- 6062 Jamaica Ct
- 6063 W Avenue j3
- 44237 Brandon Thomas Way
- 44231 Brandon Thomas Way
- 6069 Jamaica Ct
- 44243 Brandon Thomas Way
- 44304 Brandon Thomas Way
- 6110 W Avenue J 3
- 6104 W Avenue j3
- 6104 W Lancaster Ave Unit J-3
- 6110 W Avenue j3
- 6056 Jamaica Ct
- 6057 W Avenue j3
- 44249 Brandon Thomas Way
- 6066 W Avenue j3
- 6116 W Avenue j3
Your Personal Tour Guide
Ask me questions while you tour the home.