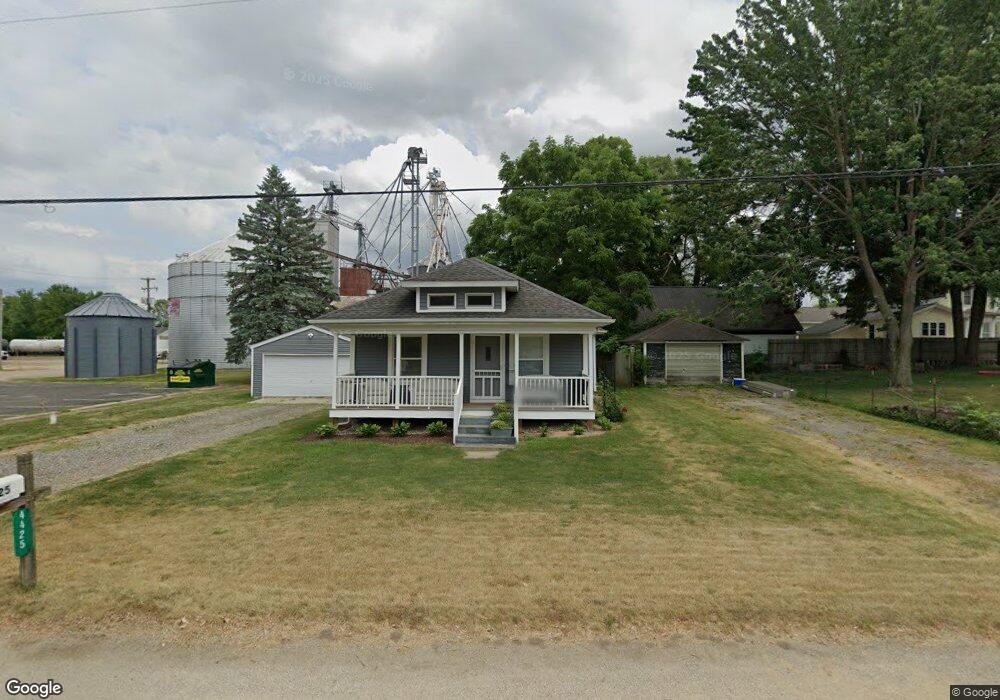
4425 Chappel St Wayland, MI 49348
Estimated Value: $194,297 - $301,000
3
Beds
1
Bath
1
Sq Ft
$252,074/Sq Ft
Est. Value
About This Home
This home is located at 4425 Chappel St, Wayland, MI 49348 and is currently estimated at $252,074, approximately $252,074 per square foot. 4425 Chappel St is a home located in Allegan County with nearby schools including Wayland High School and Moline Christian School.
Ownership History
Date
Name
Owned For
Owner Type
Purchase Details
Closed on
Oct 27, 2022
Sold by
Johnson Wesley A and Johnson Elizabeth M
Bought by
Vanderwoude Morgan L
Current Estimated Value
Home Financials for this Owner
Home Financials are based on the most recent Mortgage that was taken out on this home.
Original Mortgage
$139,500
Outstanding Balance
$135,166
Interest Rate
6.94%
Mortgage Type
Balloon
Estimated Equity
$116,908
Purchase Details
Closed on
Mar 9, 2005
Sold by
Johnson Wesley A
Bought by
Johnson Wesley A and Johnson Elizabeth M
Home Financials for this Owner
Home Financials are based on the most recent Mortgage that was taken out on this home.
Original Mortgage
$71,000
Interest Rate
5.67%
Mortgage Type
New Conventional
Purchase Details
Closed on
Nov 16, 2001
Sold by
Shuck Diann
Bought by
Johnson Wesley
Purchase Details
Closed on
Jul 2, 1996
Sold by
Dorr Duane Dale and Dorr Gina D
Bought by
Shuck Diann
Create a Home Valuation Report for This Property
The Home Valuation Report is an in-depth analysis detailing your home's value as well as a comparison with similar homes in the area
Home Values in the Area
Average Home Value in this Area
Purchase History
| Date | Buyer | Sale Price | Title Company |
|---|---|---|---|
| Vanderwoude Morgan L | $155,000 | Denali Title | |
| Johnson Wesley A | -- | Trans Title | |
| Johnson Wesley | $70,000 | Metropolitan Title Co | |
| Shuck Diann | $63,000 | -- |
Source: Public Records
Mortgage History
| Date | Status | Borrower | Loan Amount |
|---|---|---|---|
| Open | Vanderwoude Morgan L | $139,500 | |
| Previous Owner | Johnson Wesley A | $71,000 |
Source: Public Records
Tax History Compared to Growth
Tax History
| Year | Tax Paid | Tax Assessment Tax Assessment Total Assessment is a certain percentage of the fair market value that is determined by local assessors to be the total taxable value of land and additions on the property. | Land | Improvement |
|---|---|---|---|---|
| 2025 | $2,085 | $67,700 | $19,700 | $48,000 |
| 2024 | $2,052 | $67,800 | $19,400 | $48,400 |
| 2023 | $2,021 | $60,100 | $18,400 | $41,700 |
| 2022 | $2,052 | $46,300 | $14,100 | $32,200 |
| 2021 | $1,930 | $43,500 | $13,400 | $30,100 |
| 2020 | $1,495 | $43,500 | $13,400 | $30,100 |
| 2019 | $1,877 | $40,600 | $11,000 | $29,600 |
| 2018 | $1,827 | $40,600 | $13,900 | $26,700 |
| 2017 | $0 | $39,600 | $11,000 | $28,600 |
| 2016 | $0 | $34,700 | $11,000 | $23,700 |
| 2015 | -- | $34,700 | $11,000 | $23,700 |
| 2014 | -- | $36,700 | $11,500 | $25,200 |
| 2013 | -- | $36,000 | $11,500 | $24,500 |
Source: Public Records
Map
Nearby Homes
- 4351 Hickory View Ct
- 4335 Tavistock Dr
- 4316 Sussex Place
- Lot 11 Walnut Dale Dr
- 4273 Highpoint Dr Unit 112
- Unit 111 Highpoint Dr
- 4274 Butternut Dr
- Lot 142 Butternut Dr
- Lot 141 Butternut Dr
- 4249 Butternut Dr
- 4240 Butternut Dr
- Vienna Plan at Harvest Meadows
- Charlotte Plan at Harvest Meadows
- Sierra Plan at Harvest Meadows
- Karolynn Plan at Harvest Meadows
- Reno Plan at Harvest Meadows
- Bayberry Plan at Harvest Meadows
- Freedom Plan at Harvest Meadows
- London Plan at Harvest Meadows
- Hampton Plan at Harvest Meadows
- 1229 Rosewood St
- 1231 Rosewood Ave
- 1229 Rosewood Ave
- 1225 Rosewood Ave
- 1235 Peony St
- 1238 Peony Ave
- 1237 Rosewood Ave
- 1237 Peony Ave
- 1232 Rosewood St
- 1228 Rosewood St
- 4414 Chappel St
- 1228 Rosewood Ave
- 1232 Rosewood Ave
- 1239 Peony Ave
- 1243 Rosewood St
- 4412 Chappel St
- 4438 Park Ave
- 4437 Chappel St
- 4438 Park St
- 1238 Rosewood Ave