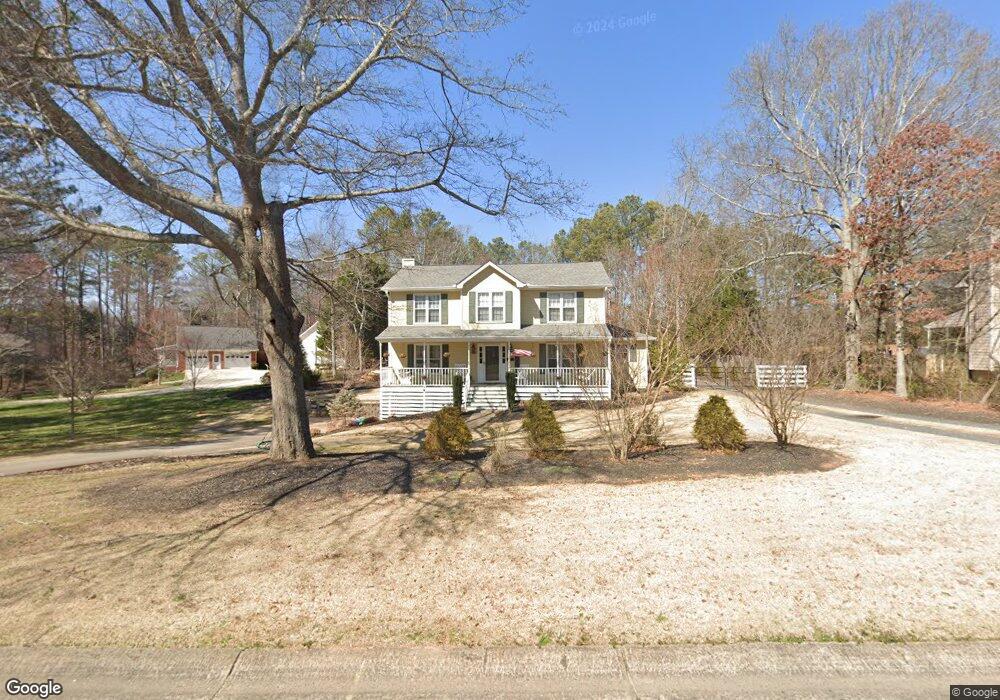
4425 Indian Trace Dr Unit 4 Alpharetta, GA 30004
Union Hill NeighborhoodEstimated Value: $498,108 - $633,000
3
Beds
3
Baths
2,300
Sq Ft
$246/Sq Ft
Est. Value
About This Home
This home is located at 4425 Indian Trace Dr Unit 4, Alpharetta, GA 30004 and is currently estimated at $566,027, approximately $246 per square foot. 4425 Indian Trace Dr Unit 4 is a home located in Cherokee County with nearby schools including Free Home Elementary School, Creekland Middle School, and Creekview High School.
Ownership History
Date
Name
Owned For
Owner Type
Purchase Details
Closed on
Nov 16, 2016
Sold by
Kimberly A
Bought by
Jones Chelsea
Current Estimated Value
Home Financials for this Owner
Home Financials are based on the most recent Mortgage that was taken out on this home.
Original Mortgage
$252,200
Outstanding Balance
$202,569
Interest Rate
3.52%
Mortgage Type
New Conventional
Estimated Equity
$363,458
Purchase Details
Closed on
Dec 9, 2005
Sold by
Catalyst Investments Llc
Bought by
Velutini Mark S and Velutini Kimberly A
Home Financials for this Owner
Home Financials are based on the most recent Mortgage that was taken out on this home.
Original Mortgage
$185,300
Interest Rate
6.87%
Mortgage Type
New Conventional
Purchase Details
Closed on
Oct 29, 2004
Sold by
Defenbaugh Steven M and Defenbaugh Patricia
Bought by
Bryan David M
Home Financials for this Owner
Home Financials are based on the most recent Mortgage that was taken out on this home.
Original Mortgage
$18,500
Interest Rate
5.65%
Create a Home Valuation Report for This Property
The Home Valuation Report is an in-depth analysis detailing your home's value as well as a comparison with similar homes in the area
Home Values in the Area
Average Home Value in this Area
Purchase History
| Date | Buyer | Sale Price | Title Company |
|---|---|---|---|
| Jones Chelsea | $260,000 | -- | |
| Velutini Mark S | $218,000 | -- | |
| Bryan David M | $185,000 | -- |
Source: Public Records
Mortgage History
| Date | Status | Borrower | Loan Amount |
|---|---|---|---|
| Open | Jones Chelsea | $252,200 | |
| Previous Owner | Velutini Mark S | $185,300 | |
| Previous Owner | Bryan David M | $18,500 |
Source: Public Records
Tax History Compared to Growth
Tax History
| Year | Tax Paid | Tax Assessment Tax Assessment Total Assessment is a certain percentage of the fair market value that is determined by local assessors to be the total taxable value of land and additions on the property. | Land | Improvement |
|---|---|---|---|---|
| 2025 | $3,831 | $160,420 | $20,800 | $139,620 |
| 2024 | $4,042 | $171,860 | $20,800 | $151,060 |
| 2023 | $3,597 | $171,420 | $20,800 | $150,620 |
| 2022 | $3,478 | $143,140 | $20,800 | $122,340 |
| 2021 | $3,396 | $127,212 | $20,800 | $106,412 |
| 2020 | $3,247 | $120,680 | $20,800 | $99,880 |
| 2019 | $3,155 | $116,720 | $20,800 | $95,920 |
| 2018 | $3,000 | $109,360 | $20,800 | $88,560 |
| 2017 | $2,899 | $260,200 | $20,800 | $83,280 |
| 2016 | $2,287 | $202,500 | $14,000 | $67,000 |
| 2015 | $2,299 | $201,300 | $14,000 | $66,520 |
| 2014 | $2,082 | $182,400 | $14,000 | $58,960 |
Source: Public Records
Map
Nearby Homes
- 4415 Indian Trace Dr
- 2675 Holbrook Campground Rd
- 2687 Holbrook Campground Rd
- 5385 Drew Rd
- 7933 Midway Rd
- 212 Silver Birch Ct
- 4465 Mossbrook Cir
- 490 Lummus Rd
- 4645 Hamptons Dr
- 205 Brighten Ct
- 4655 Hamptons Dr
- 7880 Brands Hatch Blvd
- 412 Manor Ridge View
- 4750 Hamptons Dr
- 7825 Brands Hatch Blvd
- 7619 Campground Rd
- 116 Waverly Dr
- 5120 Bristlecone Pine Way
- 4425 Indian Trace Dr
- 4445 Indian Trace Dr
- 4420 Indian Trace Dr
- 4405 Indian Trace Dr
- 4430 Indian Trace Dr
- 4410 Indian Trace Dr
- 4440 Indian Trace Dr
- 4395 Indian Trace Dr
- 4455 Indian Trace Dr
- 4400 Indian Trace Dr
- 4450 Indian Trace Dr
- 4460 Indian Trace Dr
- 4465 Indian Trace Dr
- 41 Holbrook Campground Rd
- 2699 Holbrook Campground Rd
- 0 Holbrook Campground Rd Unit 3257610
- 0 Holbrook Campground Rd Unit 3193609
- 0 Holbrook Campground Rd Unit 8286420
- 0 Holbrook Campground Rd Unit 8513075
- 0 Holbrook Campground Rd Unit 8343392