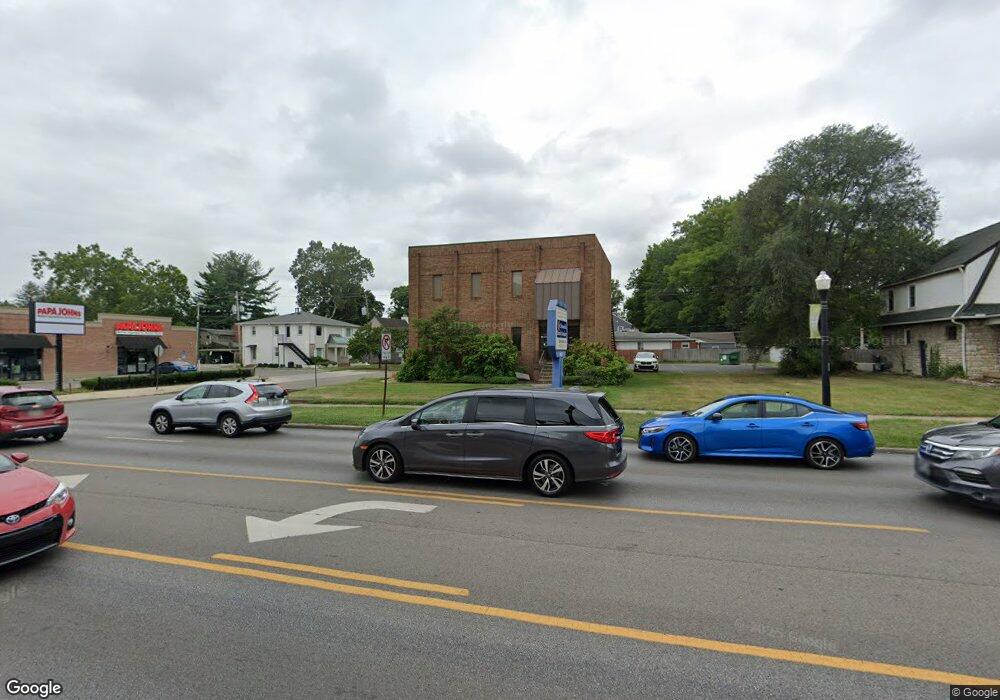
4425 N High St Columbus, OH 43214
Clintonville Neighborhood
Studio
--
Bath
1,100
Sq Ft
7,492
Sq Ft Lot
About This Home
This home is located at 4425 N High St, Columbus, OH 43214. 4425 N High St is a home located in Franklin County with nearby schools including Indian Springs Elementary School, Dominion Middle School, and Whetstone High School.
Ownership History
Date
Name
Owned For
Owner Type
Purchase Details
Closed on
Nov 19, 2007
Sold by
Pond Robert J and Pond Mary Ann
Bought by
Sa & Alex Investment Group Llc
Home Financials for this Owner
Home Financials are based on the most recent Mortgage that was taken out on this home.
Original Mortgage
$9,416
Outstanding Balance
$5,860
Interest Rate
6.33%
Mortgage Type
Commercial
Purchase Details
Closed on
Apr 27, 2007
Sold by
Pond Robert J and Pond Mary Ann
Bought by
Pond Robert J and Pond Mary Ann
Purchase Details
Closed on
Nov 15, 2006
Sold by
High Schreyer Co
Bought by
Pond Robert J and Pond Mary Ann
Purchase Details
Closed on
Apr 5, 2004
Sold by
Pond Robert J
Bought by
Park Yeonsoo S
Home Financials for this Owner
Home Financials are based on the most recent Mortgage that was taken out on this home.
Original Mortgage
$333,169
Interest Rate
7%
Mortgage Type
Seller Take Back
Purchase Details
Closed on
May 13, 1974
Bought by
High-Schreyer Co
Create a Home Valuation Report for This Property
The Home Valuation Report is an in-depth analysis detailing your home's value as well as a comparison with similar homes in the area
Home Values in the Area
Average Home Value in this Area
Purchase History
| Date | Buyer | Sale Price | Title Company |
|---|---|---|---|
| Sa & Alex Investment Group Llc | $465,000 | Talon Group | |
| Pond Robert J | -- | Attorney | |
| Pond Robert J | -- | Talon Group | |
| Park Yeonsoo S | $335,000 | -- | |
| High-Schreyer Co | -- | -- |
Source: Public Records
Mortgage History
| Date | Status | Borrower | Loan Amount |
|---|---|---|---|
| Open | Sa & Alex Investment Group Llc | $9,416 | |
| Open | Sa & Alex Investment Group Llc | $418,500 | |
| Previous Owner | Park Yeonsoo S | $333,169 |
Source: Public Records
Tax History
| Year | Tax Paid | Tax Assessment Tax Assessment Total Assessment is a certain percentage of the fair market value that is determined by local assessors to be the total taxable value of land and additions on the property. | Land | Improvement |
|---|---|---|---|---|
| 2025 | $10,896 | $146,800 | $39,310 | $107,490 |
| 2024 | $10,896 | $146,800 | $39,310 | $107,490 |
| 2023 | $10,723 | $146,800 | $39,310 | $107,490 |
| 2022 | $10,264 | $136,860 | $28,810 | $108,050 |
| 2021 | $10,308 | $136,860 | $28,810 | $108,050 |
| 2020 | $10,237 | $136,860 | $28,810 | $108,050 |
| 2019 | $10,248 | $124,430 | $26,220 | $98,210 |
| 2018 | $9,927 | $124,430 | $26,220 | $98,210 |
| 2017 | $10,309 | $124,430 | $26,220 | $98,210 |
| 2016 | $10,381 | $119,290 | $26,220 | $93,070 |
| 2015 | $9,639 | $119,290 | $26,220 | $93,070 |
| 2014 | $9,634 | $119,290 | $26,220 | $93,070 |
| 2013 | $4,774 | $119,280 | $26,215 | $93,065 |
Source: Public Records
Map
Nearby Homes
- 142 W Schreyer Place
- 151 W Dominion Blvd
- 243 E Schreyer Place
- 4466 Olentangy Blvd
- 325 Starrett Ct
- 144 Wetmore Rd
- 82 Blenheim Rd
- 390 Lenappe Dr
- 103 E Jeffrey Place
- 389 Wetmore Rd
- 435 E Beaumont Rd
- 188 Chatham Rd
- 62 W Rathbone Ave
- 122 W Rathbone Ave
- 4753 Olentangy River Rd Unit ''B''
- 126 Erie Rd
- 522 E Beechwold Blvd
- 655 Providence Ave Unit B
- 374 Acton Rd
- 650 Providence Ave Unit F
- 4425 N High St Unit 200
- 4425 N High St Unit 300
- 4443 N High St
- 0 N High St
- 11 W Schreyer Place
- 28 W Schreyer Place
- 4409 N High St
- 34 W Schreyer Place
- 25 W Schreyer Place
- 33 W Schreyer Place
- 25 W Dominion Blvd
- 40 W Schreyer Place
- 33 W Dominion Blvd
- 46 W Schreyer Place
- 26 W Henderson Rd
- 28 W Henderson Rd
- 28 W Henderson Rd Unit 26 - 28
- 45 W Schreyer Place
- 37 W Dominion Blvd
- 10 E Henderson Rd
Your Personal Tour Guide
Ask me questions while you tour the home.