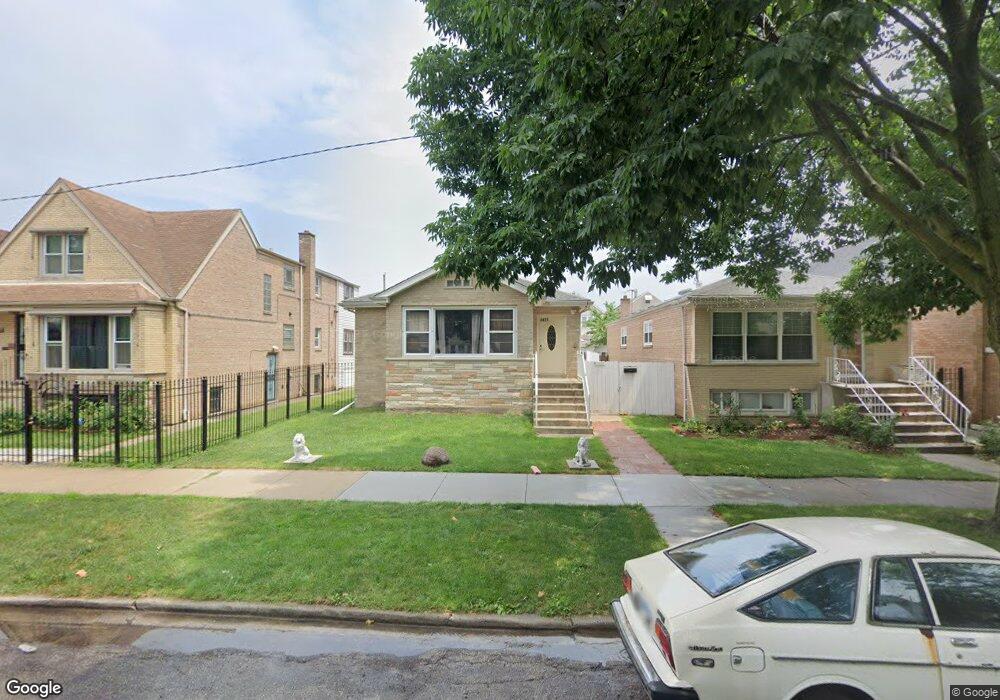
4425 S Maplewood Ave Chicago, IL 60632
Brighton Park NeighborhoodEstimated Value: $311,412 - $364,000
4
Beds
3
Baths
1,464
Sq Ft
$229/Sq Ft
Est. Value
About This Home
This home is located at 4425 S Maplewood Ave, Chicago, IL 60632 and is currently estimated at $334,853, approximately $228 per square foot. 4425 S Maplewood Ave is a home located in Cook County with nearby schools including Shields Elementary School, Shields Middle School, and Kelly High School.
Ownership History
Date
Name
Owned For
Owner Type
Purchase Details
Closed on
Sep 1, 2006
Sold by
Castro Antonio and Castro Suzanna
Bought by
Plascencia Ignacio
Current Estimated Value
Purchase Details
Closed on
May 8, 2000
Sold by
Farraj Suleiman and Farraj Zakiyyah
Bought by
Castro Antonio and Castro Suzanna
Home Financials for this Owner
Home Financials are based on the most recent Mortgage that was taken out on this home.
Original Mortgage
$115,542
Interest Rate
8.26%
Mortgage Type
FHA
Purchase Details
Closed on
Mar 2, 2000
Sold by
Omastiak Estelle
Bought by
Farraj Suleiman and Farraj Zakiyyah
Home Financials for this Owner
Home Financials are based on the most recent Mortgage that was taken out on this home.
Original Mortgage
$30,000
Interest Rate
8.24%
Create a Home Valuation Report for This Property
The Home Valuation Report is an in-depth analysis detailing your home's value as well as a comparison with similar homes in the area
Home Values in the Area
Average Home Value in this Area
Purchase History
| Date | Buyer | Sale Price | Title Company |
|---|---|---|---|
| Plascencia Ignacio | $257,000 | First American Title Ins Co | |
| Castro Antonio | $122,000 | Professional National Title | |
| Farraj Suleiman | $90,000 | -- | |
| Omastiak Estelle | -- | -- |
Source: Public Records
Mortgage History
| Date | Status | Borrower | Loan Amount |
|---|---|---|---|
| Previous Owner | Castro Antonio | $115,542 | |
| Previous Owner | Farraj Suleiman | $30,000 |
Source: Public Records
Tax History Compared to Growth
Tax History
| Year | Tax Paid | Tax Assessment Tax Assessment Total Assessment is a certain percentage of the fair market value that is determined by local assessors to be the total taxable value of land and additions on the property. | Land | Improvement |
|---|---|---|---|---|
| 2024 | $3,752 | $28,000 | $6,045 | $21,955 |
| 2023 | $3,636 | $21,000 | $4,836 | $16,164 |
| 2022 | $3,636 | $21,000 | $4,836 | $16,164 |
| 2021 | $3,553 | $21,000 | $4,836 | $16,164 |
| 2020 | $2,856 | $15,839 | $4,836 | $11,003 |
| 2019 | $2,946 | $17,999 | $4,836 | $13,163 |
| 2018 | $2,895 | $17,999 | $4,836 | $13,163 |
| 2017 | $2,953 | $17,003 | $4,352 | $12,651 |
| 2016 | $2,924 | $17,003 | $4,352 | $12,651 |
| 2015 | $2,654 | $17,003 | $4,352 | $12,651 |
| 2014 | $2,537 | $16,134 | $4,110 | $12,024 |
| 2013 | $2,476 | $16,134 | $4,110 | $12,024 |
Source: Public Records
Map
Nearby Homes
- 4759 S Maplewood Ave
- 4757 S Maplewood Ave
- 4756 S Maplewood Ave
- 4417 S Campbell Ave
- 4415 S Rockwell St
- 4759 S Rockwell St
- 4756 S Rockwell St
- 4754 S Rockwell St
- 4334 S Western Ave
- 4609 S Rockwell St
- 2457 W 46th Place
- 4554 S Washtenaw Ave
- 2719 W Pope John Paul ii Dr
- 4605 S Fairfield Ave
- 4331 S California Ave
- 4149 S Rockwell St
- 4557 S Francisco Ave
- 4034 S Maplewood Ave
- 4024 S Rockwell St
- 4039 S Montgomery Ave
- 4429 S Maplewood Ave
- 4423 S Maplewood Ave
- 4423 S Maplewood Ave
- 4431 S Maplewood Ave
- 4419 S Maplewood Ave
- 4435 S Maplewood Ave Unit 1
- 4417 S Maplewood Ave
- 4437 S Maplewood Ave
- 4413 S Maplewood Ave
- 4439 S Maplewood Ave
- 4426 S Campbell Ave Unit 1
- 4426 S Campbell Ave
- 4428 S Campbell Ave
- 4422 S Campbell Ave
- 4411 S Maplewood Ave
- 4420 S Campbell Ave
- 4443 S Maplewood Ave Unit 1
- 4443 S Maplewood Ave Unit 1
- 4416 S Campbell Ave
- 4409 S Maplewood Ave