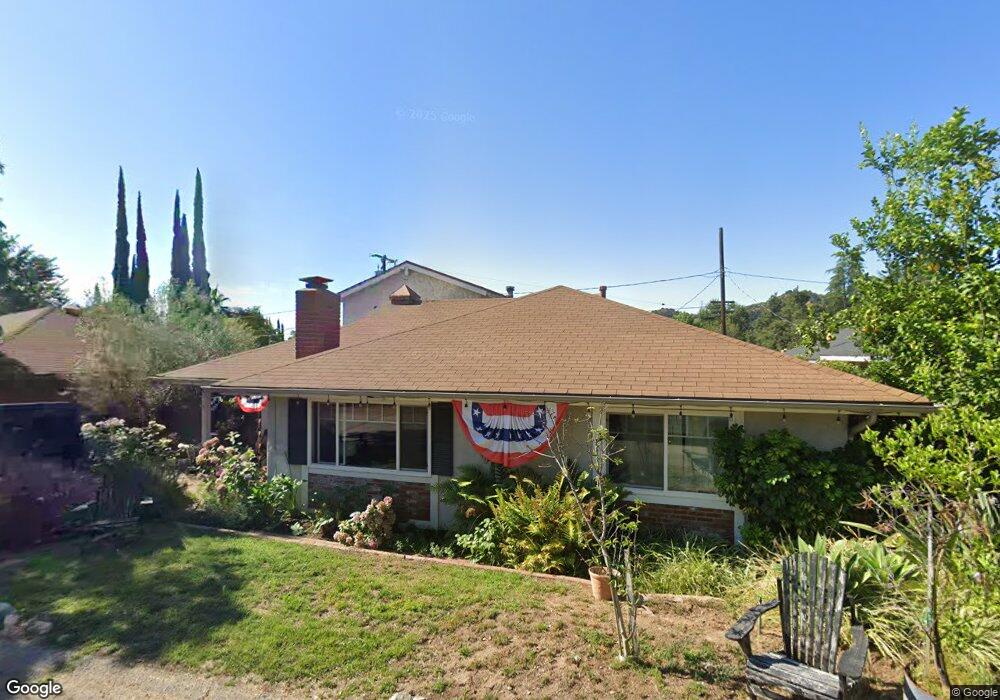
4425 Union Ave La Canada Flintridge, CA 91011
Estimated Value: $1,581,098 - $2,930,000
3
Beds
2
Baths
1,812
Sq Ft
$1,116/Sq Ft
Est. Value
About This Home
This home is located at 4425 Union Ave, La Canada Flintridge, CA 91011 and is currently estimated at $2,021,775, approximately $1,115 per square foot. 4425 Union Ave is a home located in Los Angeles County with nearby schools including La Canada Elementary School, La Canada High School, and La Canada Preparatory School.
Ownership History
Date
Name
Owned For
Owner Type
Purchase Details
Closed on
Mar 12, 2013
Sold by
Snyder Villalobos Catherine
Bought by
Snyder Villalobos Catherine
Current Estimated Value
Home Financials for this Owner
Home Financials are based on the most recent Mortgage that was taken out on this home.
Original Mortgage
$417,000
Outstanding Balance
$293,598
Interest Rate
3.49%
Mortgage Type
New Conventional
Estimated Equity
$1,728,177
Purchase Details
Closed on
Nov 18, 2008
Sold by
Villalobos Antonio
Bought by
Snyder Villalobos Catherine
Home Financials for this Owner
Home Financials are based on the most recent Mortgage that was taken out on this home.
Original Mortgage
$417,000
Interest Rate
6.47%
Mortgage Type
New Conventional
Purchase Details
Closed on
Dec 15, 1995
Sold by
Wright Susan L
Bought by
Villalobos Antonio and Snyder Villalobos Catherine
Home Financials for this Owner
Home Financials are based on the most recent Mortgage that was taken out on this home.
Original Mortgage
$229,500
Interest Rate
7.38%
Create a Home Valuation Report for This Property
The Home Valuation Report is an in-depth analysis detailing your home's value as well as a comparison with similar homes in the area
Home Values in the Area
Average Home Value in this Area
Purchase History
| Date | Buyer | Sale Price | Title Company |
|---|---|---|---|
| Snyder Villalobos Catherine | -- | Lawyers Title Sd | |
| Snyder Villalobos Catherine | -- | Pacific Coast Title | |
| Villalobos Antonio | $270,000 | Old Republic Title |
Source: Public Records
Mortgage History
| Date | Status | Borrower | Loan Amount |
|---|---|---|---|
| Open | Snyder Villalobos Catherine | $417,000 | |
| Closed | Snyder Villalobos Catherine | $417,000 | |
| Closed | Villalobos Antonio | $229,500 |
Source: Public Records
Tax History Compared to Growth
Tax History
| Year | Tax Paid | Tax Assessment Tax Assessment Total Assessment is a certain percentage of the fair market value that is determined by local assessors to be the total taxable value of land and additions on the property. | Land | Improvement |
|---|---|---|---|---|
| 2025 | $5,678 | $448,509 | $265,787 | $182,722 |
| 2024 | $5,678 | $439,716 | $260,576 | $179,140 |
| 2023 | $5,461 | $431,095 | $255,467 | $175,628 |
| 2022 | $5,266 | $422,643 | $250,458 | $172,185 |
| 2021 | $5,157 | $414,357 | $245,548 | $168,809 |
| 2019 | $4,998 | $402,069 | $238,266 | $163,803 |
| 2018 | $4,853 | $394,187 | $233,595 | $160,592 |
| 2016 | $4,669 | $378,882 | $224,525 | $154,357 |
| 2015 | $4,609 | $373,192 | $221,153 | $152,039 |
| 2014 | $4,551 | $365,882 | $216,821 | $149,061 |
Source: Public Records
Map
Nearby Homes
- 4467 Ardara Place
- 1237 Descanso Dr
- 1304 Padres Trail
- 4639 El Camino Corto
- 4825 Angeles Crest Hwy
- 4720 Olive Ct
- 909 Coral Way
- 4644 Hillard Ave
- 4938 Angeles Crest Hwy
- 5123 Caroli Ln
- 5046 Fallhaven Ln
- 2048 Valderas Dr
- 4430 Rosebank Dr
- 5130 Hayman Ave
- 2102 La Canada Crest Dr Unit B
- 2222 Montrose Ave Unit G
- 1929 Lyans Dr
- 1116 Flintridge Ave
- 2249 Montrose Ave Unit 7
- 5117 Stoneglen Rd
- 4423 Union Ave
- 4427 Union Ave
- 4422 Indiana Ave
- 4421 Union Ave
- 4415 Union Ave
- 1417 Verdugo Blvd
- 4416 Indiana Ave
- 1413 Verdugo Blvd
- 1423 Verdugo Blvd
- 1407 Verdugo Blvd
- 4418 Indiana Ave
- 4411 Union Ave
- 1427 Verdugo Blvd
- 1403 Verdugo Blvd
- 1403 Verdugo Blvd
- 4412 Indiana Ave
- 4419 Indiana Ave
- 4413 Indiana Ave
- 4414 Union Ave
- 4420 Union St