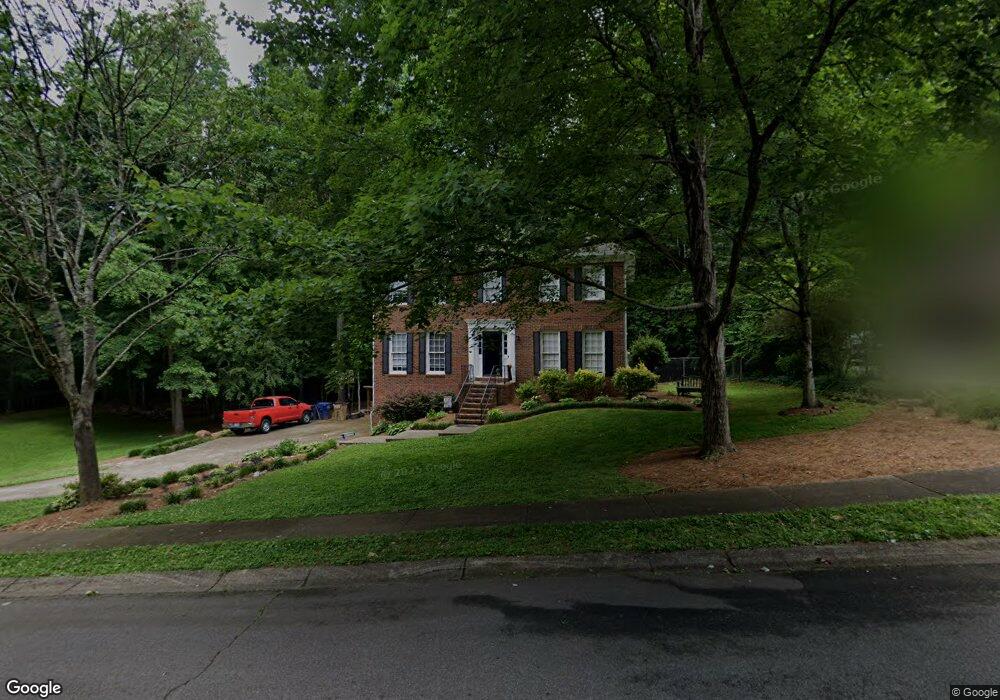
4426 E Brandon Dr NE Marietta, GA 30066
Sandy Plains NeighborhoodEstimated Value: $519,493 - $580,000
4
Beds
3
Baths
2,604
Sq Ft
$209/Sq Ft
Est. Value
About This Home
This home is located at 4426 E Brandon Dr NE, Marietta, GA 30066 and is currently estimated at $545,123, approximately $209 per square foot. 4426 E Brandon Dr NE is a home located in Cobb County with nearby schools including Rocky Mount Elementary School, Mabry Middle School, and Lassiter High School.
Ownership History
Date
Name
Owned For
Owner Type
Purchase Details
Closed on
May 13, 2011
Sold by
Hud & Housing Of Urban Dev
Bought by
Daswani Arun and Daswani Mamta
Current Estimated Value
Purchase Details
Closed on
Feb 2, 2010
Sold by
Phh Mtg
Bought by
Hud-Housing Of Urban Dev
Purchase Details
Closed on
May 29, 2002
Sold by
Moser David R and Moser Catherine D
Bought by
Quick Terry L
Home Financials for this Owner
Home Financials are based on the most recent Mortgage that was taken out on this home.
Original Mortgage
$179,254
Interest Rate
6.92%
Mortgage Type
FHA
Purchase Details
Closed on
Aug 29, 1997
Sold by
Etter Stephen A and Etter Lisa B
Bought by
Moser David R and Moser Catherine D
Home Financials for this Owner
Home Financials are based on the most recent Mortgage that was taken out on this home.
Original Mortgage
$132,300
Interest Rate
7%
Mortgage Type
New Conventional
Create a Home Valuation Report for This Property
The Home Valuation Report is an in-depth analysis detailing your home's value as well as a comparison with similar homes in the area
Home Values in the Area
Average Home Value in this Area
Purchase History
| Date | Buyer | Sale Price | Title Company |
|---|---|---|---|
| Daswani Arun | $92,000 | -- | |
| Hud-Housing Of Urban Dev | -- | -- | |
| Phh Mtg | $172,141 | -- | |
| Quick Terry L | $182,100 | -- | |
| Moser David R | $147,000 | -- |
Source: Public Records
Mortgage History
| Date | Status | Borrower | Loan Amount |
|---|---|---|---|
| Previous Owner | Quick Terry L | $179,254 | |
| Previous Owner | Moser David R | $132,300 |
Source: Public Records
Tax History Compared to Growth
Tax History
| Year | Tax Paid | Tax Assessment Tax Assessment Total Assessment is a certain percentage of the fair market value that is determined by local assessors to be the total taxable value of land and additions on the property. | Land | Improvement |
|---|---|---|---|---|
| 2025 | $6,161 | $204,472 | $32,000 | $172,472 |
| 2024 | $4,939 | $163,804 | $30,800 | $133,004 |
| 2023 | $4,939 | $163,804 | $30,800 | $133,004 |
| 2022 | $3,711 | $122,288 | $26,000 | $96,288 |
| 2021 | $3,711 | $122,288 | $26,000 | $96,288 |
| 2020 | $3,711 | $122,288 | $26,000 | $96,288 |
| 2019 | $3,367 | $110,928 | $19,200 | $91,728 |
| 2018 | $2,947 | $97,104 | $10,400 | $86,704 |
| 2017 | $2,560 | $89,036 | $10,400 | $78,636 |
| 2016 | $2,560 | $89,036 | $10,400 | $78,636 |
| 2015 | $2,174 | $73,780 | $10,000 | $63,780 |
| 2014 | $2,192 | $73,780 | $0 | $0 |
Source: Public Records
Map
Nearby Homes
- 2603 Chadwick Rd
- 2610 Chadwick Rd
- 4499 Browning Ct NE
- 2402 Woodbridge Dr
- 4050 Idlewilde Meadows Dr NE
- 4056 Longford Dr NE
- 4464 Windsor Oaks Dr
- 4709 Trickum Rd NE
- 4509 N Landing Dr
- 2124 Lassiter Field Dr NE
- 4509 N Bay Ct
- 2578 Middle Coray Cir
- 2958 Forest Chase Terrace NE
- 4259 Arbor Club Dr
- 2256 Turtle Club Dr NE Unit 1
- 4592 N Landing Dr
- 3844 Havenrock
- 3816 Havenrock Dr
- 4422 E Brandon Dr NE
- E E Brandon Dr NE
- 4423 E Brandon Dr NE
- 4412 E Brandon Dr NE Unit 2
- 4342 Brandon Ridge Dr NE
- 2601 Dering Gate Dr
- 4403 E Brandon Dr NE
- 4402 E Brandon Dr NE
- 4352 Brandon Cove NE
- 4395 E Brandon Dr NE
- 4332 Brandon Ridge Dr NE Unit 1
- 2601 Ainsley Ct
- 4390 E Brandon Dr NE
- 4428 E Brandon Dr NE Unit III
- 4362 Brandon Cove NE
- 2600 Ainsley Ct
- 2600 Dering Gate Dr
- 4385 E Brandon Dr NE
- 4430 E Brandon Dr NE
- 4349 Stockton Way