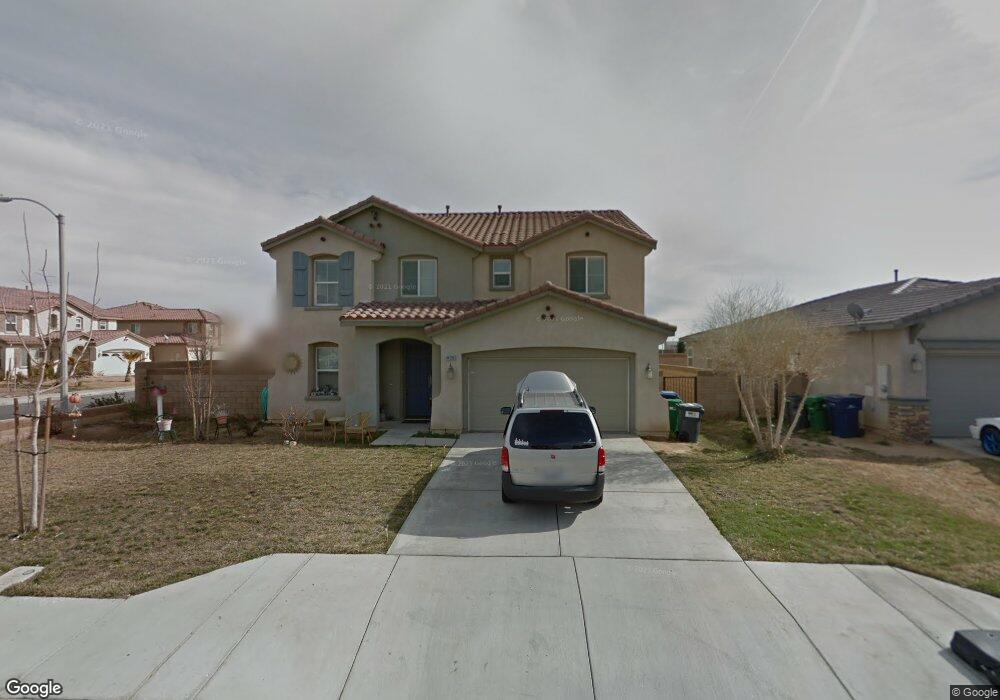
44260 Begonia St Lancaster, CA 93535
East Lancaster NeighborhoodEstimated Value: $505,160 - $544,000
4
Beds
3
Baths
2,843
Sq Ft
$183/Sq Ft
Est. Value
About This Home
This home is located at 44260 Begonia St, Lancaster, CA 93535 and is currently estimated at $521,040, approximately $183 per square foot. 44260 Begonia St is a home located in Los Angeles County with nearby schools including Columbia Elementary School, Gifford C. Cole Middle School, and Eastside High School.
Ownership History
Date
Name
Owned For
Owner Type
Purchase Details
Closed on
May 13, 2009
Sold by
Arussi Moshe
Bought by
Arussi Moshe and The Moshe Arussi Living Trust
Current Estimated Value
Purchase Details
Closed on
Sep 9, 2008
Sold by
Consumer Solutions Reo Llc
Bought by
Arussi Moshe
Purchase Details
Closed on
Aug 16, 2007
Sold by
Morales Fernando
Bought by
Wmc Mortgage Corp
Purchase Details
Closed on
Mar 3, 2006
Sold by
Kb Home Greater Los Angeles Inc
Bought by
Morales Fernando
Home Financials for this Owner
Home Financials are based on the most recent Mortgage that was taken out on this home.
Original Mortgage
$309,644
Interest Rate
7.25%
Mortgage Type
Fannie Mae Freddie Mac
Purchase Details
Closed on
Feb 19, 2006
Sold by
Wmc Mortgage Corp
Bought by
Consumer Solutions Reo Llc
Home Financials for this Owner
Home Financials are based on the most recent Mortgage that was taken out on this home.
Original Mortgage
$309,644
Interest Rate
7.25%
Mortgage Type
Fannie Mae Freddie Mac
Create a Home Valuation Report for This Property
The Home Valuation Report is an in-depth analysis detailing your home's value as well as a comparison with similar homes in the area
Home Values in the Area
Average Home Value in this Area
Purchase History
| Date | Buyer | Sale Price | Title Company |
|---|---|---|---|
| Arussi Moshe | -- | None Available | |
| Arussi Moshe | $176,000 | First American Title Ins Co | |
| Wmc Mortgage Corp | $324,000 | Landsafe Title | |
| Morales Fernando | $387,500 | First American Title Ins Co | |
| Consumer Solutions Reo Llc | -- | First American Title Ins Co |
Source: Public Records
Mortgage History
| Date | Status | Borrower | Loan Amount |
|---|---|---|---|
| Previous Owner | Morales Fernando | $309,644 |
Source: Public Records
Tax History
| Year | Tax Paid | Tax Assessment Tax Assessment Total Assessment is a certain percentage of the fair market value that is determined by local assessors to be the total taxable value of land and additions on the property. | Land | Improvement |
|---|---|---|---|---|
| 2025 | $4,240 | $226,116 | $56,525 | $169,591 |
| 2024 | $4,240 | $221,683 | $55,417 | $166,266 |
| 2023 | $4,115 | $217,337 | $54,331 | $163,006 |
| 2022 | $3,978 | $213,076 | $53,266 | $159,810 |
| 2021 | $3,608 | $208,899 | $52,222 | $156,677 |
| 2019 | $3,535 | $202,705 | $50,674 | $152,031 |
| 2018 | $3,476 | $198,731 | $49,681 | $149,050 |
| 2016 | $3,308 | $191,015 | $47,752 | $143,263 |
| 2015 | $3,263 | $188,147 | $47,035 | $141,112 |
| 2014 | $3,266 | $184,462 | $46,114 | $138,348 |
Source: Public Records
Map
Nearby Homes
- 44232 Begonia St
- 0 30th St E Unit 25004292
- 2745 Garnet Ln
- 3311 Topaz Ln
- 44135 Camellia St
- 44105 Acacia St
- 3103 Emerald Ln
- 2559 E Avenue j2
- 3248 E Avenue J
- 2611 Via Romana
- 3211 E Avenue J 4
- 3258 E Avenue J
- 3264 E Avenue J
- 3265 E Avenue J-3 Dr
- 110 E Avenue J 8
- 100 E Avenue J 8
- 3270 E Avenue J-3 Dr
- 3223 E Avenue J 4
- 2601 Via Madalena
- 3258 E Avenue j3
- 44254 Begonia St
- 44246 Begonia St
- 2829 E Avenue j2
- 44261 Begonia St
- 2823 E Avenue j2
- 2835 E Avenue j2 Unit 2
- 2835 E Avenue j2
- 44253 Begonia St
- 2817 E Avenue j2
- 2841 E Avenue j2
- 44240 Begonia St
- 44247 Begonia St
- 2811 E Avenue j2
- 44262 Maria Cir
- 44256 Maria Cir
- 44317 Acacia St
- 44241 Begonia St
- 44326 Jefferson Ct
- 2805 E Avenue j2
- 44324 Jefferson Ct
Your Personal Tour Guide
Ask me questions while you tour the home.