


4427 Chantilly Way Pensacola, FL 32505
Northwest Pensacola Neighborhood
3
Beds
2
Baths
1,506
Sq Ft
9,583
Sq Ft Lot
Highlights
- In Ground Pool
- Corner Lot
- Formal Dining Room
- Pensacola High School Rated A-
- No HOA
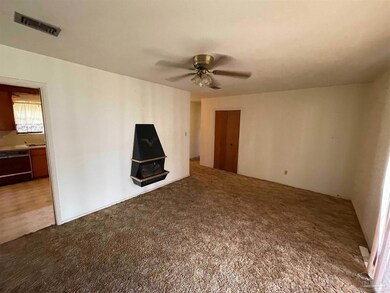
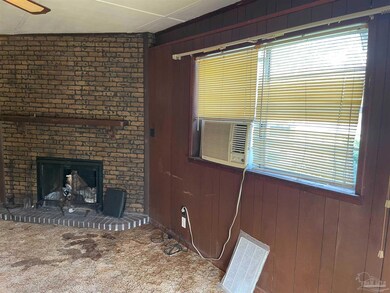
- Fireplace
About This Home
As of December 2021AS-IS and Cash offers only. Pool.
Last Agent to Sell the Property
TEAM SANDY BLANTON REALTY, INC Brokerage Phone: 850-990-3475 Listed on: 10/01/2021
Last Buyer's Agent
Outside Area Selling Agent
PAR Outside Area Listing Office
Home Details
Home Type
- Single Family
Est. Annual Taxes
- $1,589
Year Built
- Built in 1965
Lot Details
- 9,583 Sq Ft Lot
- Partially Fenced Property
- Corner Lot
Parking
- Driveway
Home Design
- Brick Exterior Construction
- Slab Foundation
- Frame Construction
- Composition Roof
Interior Spaces
- 1,506 Sq Ft Home
- 1-Story Property
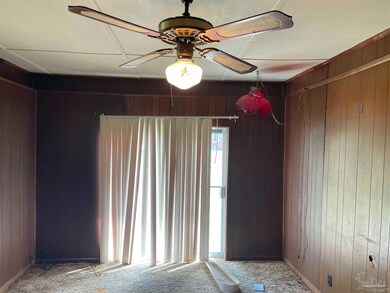
- Ceiling Fan
- Fireplace
- Family Room Downstairs
- Formal Dining Room
- Inside Utility
- Fire and Smoke Detector
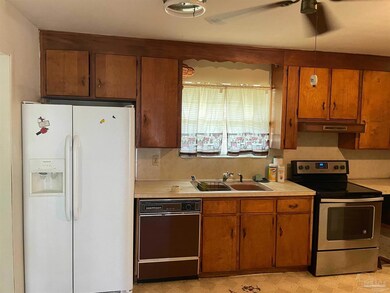
Kitchen
- Eat-In Kitchen
- Dishwasher
Flooring
- Carpet
- Vinyl
Bedrooms and Bathrooms
- 3 Bedrooms
- 2 Full Bathrooms
Laundry
- Laundry Room
- Washer and Dryer Hookup
Pool
- In Ground Pool
Schools
- Montclair Elementary School
- Bellview Middle School
- Pensacola High School
Utilities
- Central Heating and Cooling System
- Electric Water Heater
- Cable TV Available
Community Details
- No Home Owners Association
- Montclair Subdivision
Listing and Financial Details
- Assessor Parcel Number 102S301000006007
Ownership History
Date
Name
Owned For
Owner Type
Purchase Details
Listed on
Oct 1, 2021
Closed on
Dec 20, 2021
Sold by
East Hill Restorations Llc
Bought by
Winks Llc
Seller's Agent
Sandy Blanton
TEAM SANDY BLANTON REALTY, INC
Buyer's Agent
Outside Area Selling Agent
PAR Outside Area Listing Office
List Price
$125,000
Sold Price
$98,000
Premium/Discount to List
-$27,000
-21.6%
Home Financials for this Owner
Home Financials are based on the most recent Mortgage that was taken out on this home.
Avg. Annual Appreciation
17.78%
Purchase Details
Listed on
Sep 8, 2021
Closed on
Sep 30, 2021
Sold by
Owens Katherine E and Skanes Frankie C
Bought by
East Hill Restorations Llc
Seller's Agent
LOLA SEXSON
South Group Real Estate, LLC
Buyer's Agent
Sandy Blanton
TEAM SANDY BLANTON REALTY, INC
List Price
$112,900
Sold Price
$75,600
Premium/Discount to List
-$37,300
-33.04%
Home Financials for this Owner
Home Financials are based on the most recent Mortgage that was taken out on this home.
Avg. Annual Appreciation
194.85%
Original Mortgage
$82,245
Interest Rate
2.8%
Mortgage Type
Commercial
Similar Homes in Pensacola, FL
Create a Home Valuation Report for This Property
The Home Valuation Report is an in-depth analysis detailing your home's value as well as a comparison with similar homes in the area
Home Values in the Area
Average Home Value in this Area
Purchase History
| Date | Type | Sale Price | Title Company |
|---|---|---|---|
| Warranty Deed | $98,000 | Southtrust Law & Title Inc | |
| Warranty Deed | $75,600 | Southtrust Law & Title Inc |
Source: Public Records
Mortgage History
| Date | Status | Loan Amount | Loan Type |
|---|---|---|---|
| Previous Owner | $82,245 | Commercial |
Source: Public Records
Property History
| Date | Event | Price | Change | Sq Ft Price |
|---|---|---|---|---|
| 07/06/2025 07/06/25 | Price Changed | $217,999 | 0.0% | $145 / Sq Ft |
| 04/21/2025 04/21/25 | Price Changed | $218,000 | -0.5% | $145 / Sq Ft |
| 04/16/2025 04/16/25 | Price Changed | $219,000 | -0.5% | $145 / Sq Ft |
| 04/12/2025 04/12/25 | Price Changed | $219,999 | 0.0% | $146 / Sq Ft |
| 03/19/2025 03/19/25 | Price Changed | $220,000 | -1.8% | $146 / Sq Ft |
| 02/08/2025 02/08/25 | Price Changed | $224,000 | -0.4% | $149 / Sq Ft |
| 12/20/2024 12/20/24 | Price Changed | $225,000 | -2.2% | $149 / Sq Ft |
| 11/25/2024 11/25/24 | Price Changed | $230,000 | -2.1% | $153 / Sq Ft |
| 10/02/2024 10/02/24 | Price Changed | $235,000 | -2.1% | $156 / Sq Ft |
| 09/24/2024 09/24/24 | Price Changed | $240,000 | -2.0% | $159 / Sq Ft |
| 08/26/2024 08/26/24 | Price Changed | $245,000 | -2.0% | $163 / Sq Ft |
| 07/25/2024 07/25/24 | Price Changed | $250,000 | -2.0% | $166 / Sq Ft |
| 06/11/2024 06/11/24 | Price Changed | $255,000 | 0.0% | $169 / Sq Ft |
| 06/11/2024 06/11/24 | For Sale | $255,000 | +15.9% | $169 / Sq Ft |
| 08/08/2023 08/08/23 | Off Market | $220,000 | -- | -- |
| 07/31/2023 07/31/23 | Price Changed | $220,000 | -1.8% | $146 / Sq Ft |
| 07/26/2023 07/26/23 | Price Changed | $223,950 | +0.4% | $149 / Sq Ft |
| 06/25/2023 06/25/23 | Price Changed | $223,000 | -0.4% | $148 / Sq Ft |
| 06/15/2023 06/15/23 | Price Changed | $223,800 | 0.0% | $149 / Sq Ft |
| 05/01/2023 05/01/23 | Price Changed | $223,900 | -0.4% | $149 / Sq Ft |
| 04/22/2023 04/22/23 | Price Changed | $224,900 | -0.4% | $149 / Sq Ft |
| 04/16/2023 04/16/23 | Price Changed | $225,900 | -3.8% | $150 / Sq Ft |
| 03/09/2023 03/09/23 | Price Changed | $234,900 | 0.0% | $156 / Sq Ft |
| 02/20/2023 02/20/23 | Price Changed | $235,000 | -2.1% | $156 / Sq Ft |
| 02/06/2023 02/06/23 | Price Changed | $240,000 | -2.0% | $159 / Sq Ft |
| 01/27/2023 01/27/23 | Price Changed | $245,000 | 0.0% | $163 / Sq Ft |
| 01/27/2023 01/27/23 | For Sale | $245,000 | +6.5% | $163 / Sq Ft |
| 12/18/2022 12/18/22 | Off Market | $230,000 | -- | -- |
| 11/27/2022 11/27/22 | Price Changed | $230,000 | +5.0% | $153 / Sq Ft |
| 11/03/2022 11/03/22 | Price Changed | $219,000 | -0.5% | $145 / Sq Ft |
| 10/17/2022 10/17/22 | Price Changed | $220,000 | +2.3% | $146 / Sq Ft |
| 09/13/2022 09/13/22 | Price Changed | $215,000 | -2.3% | $143 / Sq Ft |
| 08/25/2022 08/25/22 | Price Changed | $220,000 | -2.2% | $146 / Sq Ft |
| 08/15/2022 08/15/22 | Price Changed | $225,000 | -2.2% | $149 / Sq Ft |
| 08/02/2022 08/02/22 | Price Changed | $230,000 | -2.1% | $153 / Sq Ft |
| 07/16/2022 07/16/22 | Price Changed | $235,000 | -0.8% | $156 / Sq Ft |
| 07/12/2022 07/12/22 | Price Changed | $237,000 | -0.8% | $157 / Sq Ft |
| 06/29/2022 06/29/22 | Price Changed | $239,000 | -0.4% | $159 / Sq Ft |
| 06/21/2022 06/21/22 | Price Changed | $240,000 | -2.0% | $159 / Sq Ft |
| 06/11/2022 06/11/22 | Price Changed | $245,000 | -2.0% | $163 / Sq Ft |
| 06/02/2022 06/02/22 | For Sale | $250,000 | +155.1% | $166 / Sq Ft |
| 12/28/2021 12/28/21 | Sold | $98,000 | -2.0% | $65 / Sq Ft |
| 12/07/2021 12/07/21 | Pending | -- | -- | -- |
| 11/28/2021 11/28/21 | Price Changed | $100,000 | -9.1% | $66 / Sq Ft |
| 10/06/2021 10/06/21 | Price Changed | $110,000 | -12.0% | $73 / Sq Ft |
| 10/01/2021 10/01/21 | For Sale | $125,000 | +65.3% | $83 / Sq Ft |
| 09/30/2021 09/30/21 | Sold | $75,600 | -33.0% | $50 / Sq Ft |
| 09/08/2021 09/08/21 | For Sale | $112,900 | -- | $75 / Sq Ft |
| 09/07/2021 09/07/21 | Pending | -- | -- | -- |
Source: Pensacola Association of REALTORS®
Tax History Compared to Growth
Tax History
| Year | Tax Paid | Tax Assessment Tax Assessment Total Assessment is a certain percentage of the fair market value that is determined by local assessors to be the total taxable value of land and additions on the property. | Land | Improvement |
|---|---|---|---|---|
| 2024 | $1,589 | $139,885 | $20,000 | $119,885 |
| 2023 | $1,589 | $95,404 | $0 | $0 |
| 2022 | $1,149 | $76,422 | $10,000 | $66,422 |
| 2021 | $1,302 | $84,971 | $0 | $0 |
| 2020 | $1,029 | $66,360 | $0 | $0 |
| 2019 | $416 | $46,177 | $0 | $0 |
| 2018 | $410 | $45,316 | $0 | $0 |
| 2017 | $403 | $44,384 | $0 | $0 |
| 2016 | $497 | $51,118 | $0 | $0 |
| 2015 | $484 | $51,885 | $0 | $0 |
| 2014 | $471 | $51,474 | $0 | $0 |
Source: Public Records
Agents Affiliated with this Home
-
Vanesa Gagliolo
Seller's Agent in 2022
Vanesa Gagliolo
Costa Miami Realty, LLC
(786) 768-6422
14 Total Sales
-
Sandy Blanton
Seller's Agent in 2021
Sandy Blanton
TEAM SANDY BLANTON REALTY, INC
(850) 554-9544
48 in this area
654 Total Sales
-
LOLA SEXSON
L
Seller's Agent in 2021
LOLA SEXSON
South Group Real Estate, LLC
(850) 516-4428
2 in this area
6 Total Sales
-
Jordan Williams
J
Seller Co-Listing Agent in 2021
Jordan Williams
TEAM SANDY BLANTON REALTY, INC
(850) 776-9284
6 in this area
27 Total Sales
-
O
Buyer's Agent in 2021
Outside Area Selling Agent
PAR Outside Area Listing Office
Map
Source: Pensacola Association of REALTORS®
MLS Number: 597623
APN: 10-2S-30-1000-006-007
Disclaimer: Certain information contained herein is derived from information provided by parties other than Homes.com. All information provided is deemed reliable, but is not guaranteed to be accurate and should be independently verified.
![]() Copyright© 2025 by the Multiple Listing Service of the Pensacola Association of REALTORS®. This information is believed to be accurate but is not guaranteed. Subject to verification by all parties. This data is copyrighted and may not be transmitted, retransmitted, copied, framed, repurposed, or altered in any way for any other site, individual and/or purpose without the express written permission of the Multiple Listing Service of the Pensacola Association of REALTORS®. Florida recognizes single and transaction agency relationships. Information deemed reliable but not guaranteed. Any use of search facilities of data on this site, other than by a consumer looking to purchase real estate, is prohibited. IDX information is provided exclusively for personal, non-commercial use, and may not be used for any purpose other than to identify prospective properties consumers may be interested in purchasing.
Copyright© 2025 by the Multiple Listing Service of the Pensacola Association of REALTORS®. This information is believed to be accurate but is not guaranteed. Subject to verification by all parties. This data is copyrighted and may not be transmitted, retransmitted, copied, framed, repurposed, or altered in any way for any other site, individual and/or purpose without the express written permission of the Multiple Listing Service of the Pensacola Association of REALTORS®. Florida recognizes single and transaction agency relationships. Information deemed reliable but not guaranteed. Any use of search facilities of data on this site, other than by a consumer looking to purchase real estate, is prohibited. IDX information is provided exclusively for personal, non-commercial use, and may not be used for any purpose other than to identify prospective properties consumers may be interested in purchasing.
Nearby Homes
- 4425 Chantilly Way
- 4508 Le Moyne Ln
- 913 Belair Rd
- 4408 Chantilly Way
- 4505 Ellysee Way
- 918 Belair Rd
- 4507 Landes Dr
- 4514 Florelle Way
- 907 Montclair Rd
- 4410 Guerlain Way
- 4513 Guerlain Way
- 4410 Havre Way
- 4513 Versailles Dr
- 1004 Medford Ave
- 909 Fremont Ave
- 812 Montclair Rd
- 918 Fremont Ave
- 905 Fremont Ave
- 809 Fremont Ave
- 702 Beauvais Rd