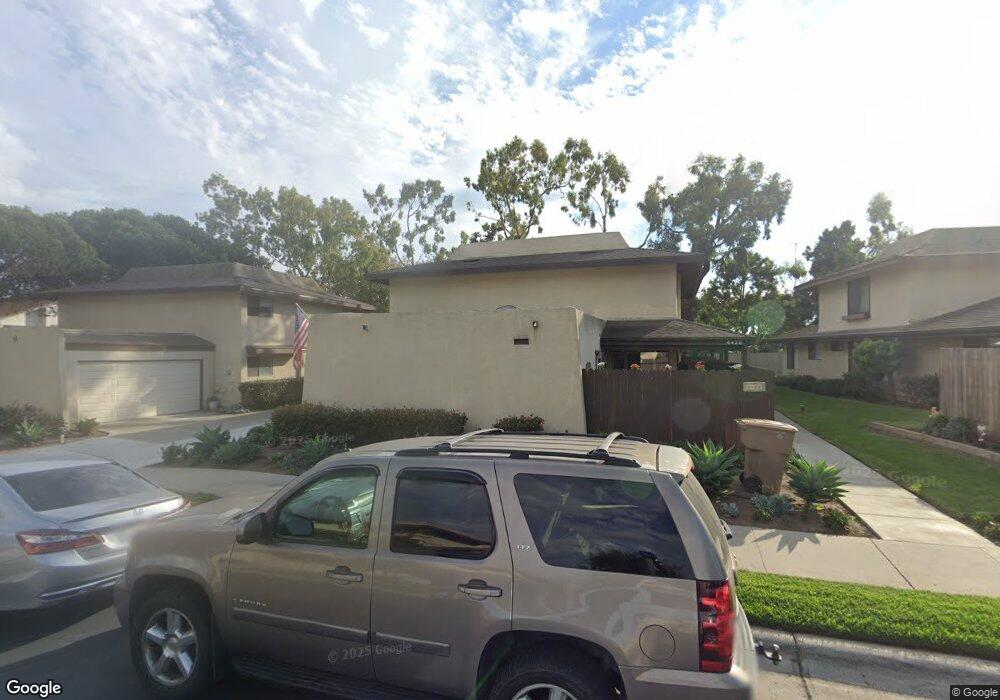
4428 Catlin Cir Unit 4 Carpinteria, CA 93013
Santa Monica-El Carro NeighborhoodEstimated Value: $808,590 - $905,000
2
Beds
2
Baths
1,024
Sq Ft
$851/Sq Ft
Est. Value
About This Home
This home is located at 4428 Catlin Cir Unit 4, Carpinteria, CA 93013 and is currently estimated at $871,898, approximately $851 per square foot. 4428 Catlin Cir Unit 4 is a home located in Santa Barbara County with nearby schools including Carpinteria Senior High School and The Howard School.
Ownership History
Date
Name
Owned For
Owner Type
Purchase Details
Closed on
Apr 14, 2003
Sold by
Chavez Nanette F
Bought by
Chavez Nanette F
Current Estimated Value
Home Financials for this Owner
Home Financials are based on the most recent Mortgage that was taken out on this home.
Original Mortgage
$270,000
Outstanding Balance
$104,026
Interest Rate
4.35%
Estimated Equity
$767,872
Purchase Details
Closed on
Feb 1, 2002
Sold by
Chavez Ralph
Bought by
Chavez Nanette F
Purchase Details
Closed on
Feb 11, 1999
Sold by
Werner Joel and Werner Renee
Bought by
Chavez Ralph and Chavez Nanette F
Home Financials for this Owner
Home Financials are based on the most recent Mortgage that was taken out on this home.
Original Mortgage
$204,250
Interest Rate
6.5%
Purchase Details
Closed on
May 9, 1994
Sold by
Bernal Christopher E and Bernal Margaret J
Bought by
Werner Joel and Werner Renee
Home Financials for this Owner
Home Financials are based on the most recent Mortgage that was taken out on this home.
Original Mortgage
$144,000
Interest Rate
3.25%
Create a Home Valuation Report for This Property
The Home Valuation Report is an in-depth analysis detailing your home's value as well as a comparison with similar homes in the area
Home Values in the Area
Average Home Value in this Area
Purchase History
| Date | Buyer | Sale Price | Title Company |
|---|---|---|---|
| Chavez Nanette F | -- | Chicago Title Co | |
| Chavez Nanette F | -- | Chicago Title Co | |
| Chavez Ralph | $215,000 | First American Title Co | |
| Werner Joel | $180,000 | First American Title |
Source: Public Records
Mortgage History
| Date | Status | Borrower | Loan Amount |
|---|---|---|---|
| Open | Chavez Nanette F | $270,000 | |
| Closed | Chavez Ralph | $204,250 | |
| Previous Owner | Werner Joel | $144,000 |
Source: Public Records
Tax History
| Year | Tax Paid | Tax Assessment Tax Assessment Total Assessment is a certain percentage of the fair market value that is determined by local assessors to be the total taxable value of land and additions on the property. | Land | Improvement |
|---|---|---|---|---|
| 2025 | $4,288 | $337,038 | $168,519 | $168,519 |
| 2023 | $4,288 | $323,952 | $161,976 | $161,976 |
| 2022 | $4,122 | $317,600 | $158,800 | $158,800 |
| 2021 | $4,026 | $311,374 | $155,687 | $155,687 |
| 2020 | $3,964 | $308,182 | $154,091 | $154,091 |
| 2019 | $3,873 | $302,140 | $151,070 | $151,070 |
| 2018 | $3,796 | $296,216 | $148,108 | $148,108 |
| 2017 | $3,715 | $290,408 | $145,204 | $145,204 |
| 2016 | $3,650 | $284,714 | $142,357 | $142,357 |
| 2015 | $3,615 | $280,438 | $140,219 | $140,219 |
| 2014 | $3,413 | $274,946 | $137,473 | $137,473 |
Source: Public Records
Map
Nearby Homes
- 4420 Catlin Cir Unit C
- 4501 Carpinteria Ave Unit C
- 910 Pear St
- 4264 Carpinteria Ave Unit 5
- 4631 Carpinteria Ave
- 4677 Carpinteria Ave Unit P
- 4725 9th St Unit 31
- 349 Ash Ave Unit Spc 17
- 349 Ash Ave Unit 45
- 1350 Tomol St
- 4731 4th St
- 4869 Carpinteria Ave
- 635 Elm Ave Unit 1
- 1230 Franciscan Ct Unit 7
- 180 Holly Ave
- 4700 Sandyland Rd Unit 23
- 1255 Franciscan Ct Unit 1
- 1260 Cravens Ln Unit 2
- 220 Elm Ave Unit 9
- 231 Linden Ave Unit 18
- 4428 Catlin Cir Unit B
- 4428 Catlin Cir Unit A
- 4428 Catlin #A Cir Unit A
- 4430 Catlin Cir
- 4430 Catlin Cir Unit A
- 4430 Catlin Unit B Cir
- 4430 Catlin Circle B
- 4426 Catlin Cir Unit B
- 4426 Catlin Cir Unit A
- 4429 Catlin Cir
- 4429 Catlin Cir Unit A
- 4429 Catlin Cir Unit B
- 4425 Catlin Cir Unit A
- 4425 Catlin Cir Unit B
- 4422 Catlin Cir Unit A
- 4422 Catlin Cir Unit B
- 4422 Catlin Cir Unit C
- 4422 Catlin Cir Unit D
- 0 Catlin Cir Unit RN-4668
- 4403 Catlin Cir Unit B
Your Personal Tour Guide
Ask me questions while you tour the home.