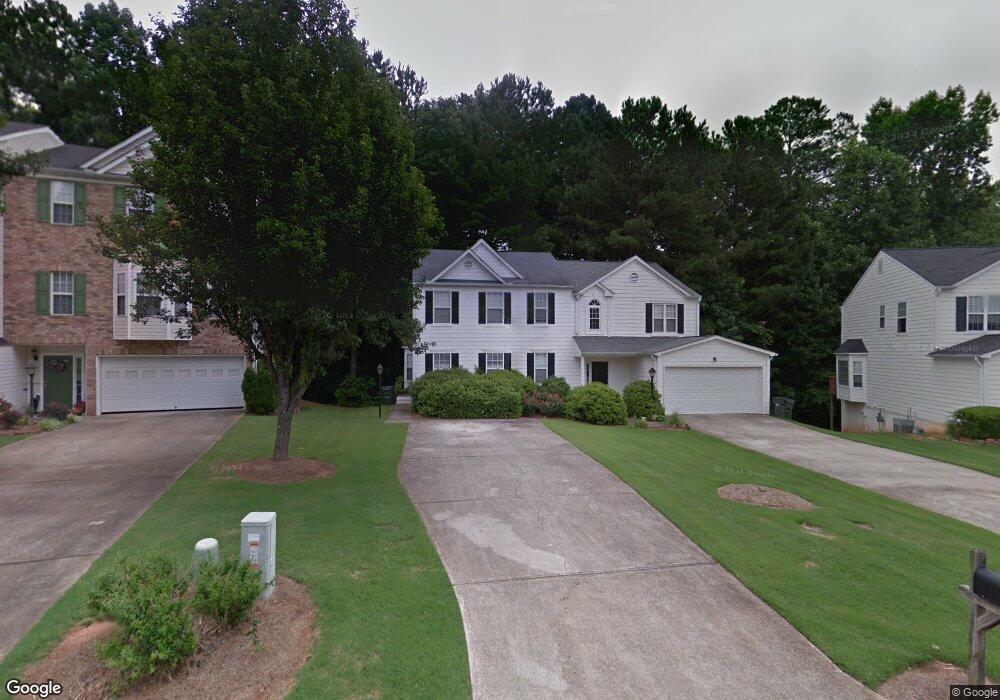
4428 Thorngate Ln Unit 4428 Acworth, GA 30101
Estimated Value: $267,842 - $292,000
2
Beds
3
Baths
1,300
Sq Ft
$215/Sq Ft
Est. Value
About This Home
This home is located at 4428 Thorngate Ln Unit 4428, Acworth, GA 30101 and is currently estimated at $278,961, approximately $214 per square foot. 4428 Thorngate Ln Unit 4428 is a home located in Cobb County with nearby schools including Baker Elementary School, Barber Middle School, and North Cobb High School.
Ownership History
Date
Name
Owned For
Owner Type
Purchase Details
Closed on
Sep 1, 2017
Sold by
Holbrook David C
Bought by
Buitrago-Meza Mauricio and Buitrago Meza I Regina I
Current Estimated Value
Home Financials for this Owner
Home Financials are based on the most recent Mortgage that was taken out on this home.
Original Mortgage
$143,355
Outstanding Balance
$120,917
Interest Rate
4.37%
Mortgage Type
FHA
Estimated Equity
$158,044
Purchase Details
Closed on
Jun 30, 2009
Sold by
Mcfarland James H
Bought by
Holbrook David C
Home Financials for this Owner
Home Financials are based on the most recent Mortgage that was taken out on this home.
Original Mortgage
$115,371
Interest Rate
4.79%
Mortgage Type
FHA
Purchase Details
Closed on
Sep 18, 2001
Sold by
Meli Deborah J
Bought by
Mcfarland James H
Home Financials for this Owner
Home Financials are based on the most recent Mortgage that was taken out on this home.
Original Mortgage
$91,268
Interest Rate
7.07%
Mortgage Type
FHA
Create a Home Valuation Report for This Property
The Home Valuation Report is an in-depth analysis detailing your home's value as well as a comparison with similar homes in the area
Home Values in the Area
Average Home Value in this Area
Purchase History
| Date | Buyer | Sale Price | Title Company |
|---|---|---|---|
| Buitrago-Meza Mauricio | $146,000 | -- | |
| Holbrook David C | $117,500 | -- | |
| Mcfarland James H | $114,900 | -- |
Source: Public Records
Mortgage History
| Date | Status | Borrower | Loan Amount |
|---|---|---|---|
| Open | Buitrago-Meza Mauricio | $143,355 | |
| Previous Owner | Holbrook David C | $115,371 | |
| Previous Owner | Mcfarland James H | $91,268 |
Source: Public Records
Tax History Compared to Growth
Tax History
| Year | Tax Paid | Tax Assessment Tax Assessment Total Assessment is a certain percentage of the fair market value that is determined by local assessors to be the total taxable value of land and additions on the property. | Land | Improvement |
|---|---|---|---|---|
| 2025 | $3,092 | $102,620 | $14,000 | $88,620 |
| 2024 | $3,094 | $102,620 | $14,000 | $88,620 |
| 2023 | $3,094 | $102,620 | $14,000 | $88,620 |
| 2022 | $2,731 | $89,988 | $14,000 | $75,988 |
| 2021 | $2,010 | $66,236 | $14,000 | $52,236 |
| 2020 | $2,640 | $66,236 | $14,000 | $52,236 |
| 2019 | $1,741 | $57,356 | $14,000 | $43,356 |
| 2018 | $1,656 | $54,564 | $12,000 | $42,564 |
| 2017 | $1,430 | $49,724 | $12,000 | $37,724 |
| 2016 | $1,151 | $40,040 | $6,000 | $34,040 |
| 2015 | $1,180 | $40,040 | $6,000 | $34,040 |
| 2014 | $1,068 | $35,944 | $0 | $0 |
Source: Public Records
Map
Nearby Homes
- 4336 Thorngate Ln
- 2553 Willow Grove Rd NW Unit 13
- 2540 Willow Grove Rd NW Unit 15
- 2773 Northgate Way NW Unit 1
- 4321 Clairesbrook Ln
- 4198 Gramercy Main NW
- 4210 Steeplehill Dr NW
- 4317 Chesapeake Trace NW
- 4662 Webster Way NW
- 2521 Eden Ridge Ln Unit 7
- 2482 Insdale Trace NW
- 4591 Grenadine Cir
- 2606 Webster Dr NW
- 2698 Claredon Trace NW
- 4561 Grenadine Cir
- 2264 Serenity Dr NW
- 2170 Sugar Maple Cove NW
- 4428 Thorngate Ln
- 4424 Thorngate Ln Unit 1
- 4434 Thorngate Ln
- 4434 Thorngate Ln Unit B
- 4422 Thorngate Ln
- 4436 Thorngate Ln Unit 111
- 4436 Thorngate Ln
- 2526 Thorngate Dr
- 2528 Thorngate Dr
- 4425 Thorngate Ln Unit 1
- 4440 Thorngate Ln
- 4423 Thorngate Ln
- 4423 Thorngate Ln
- 2524 Thorngate Dr Unit 1
- 2487 Stonegate Dr NW
- 2487 Stonegate Dr NW Unit 2487
- 4442 Thorngate Ln
- 4442 Thorngate Ln Unit 4442
- 4441 Thorngate Ln Unit 3A
- 4419 Thorngate Ln