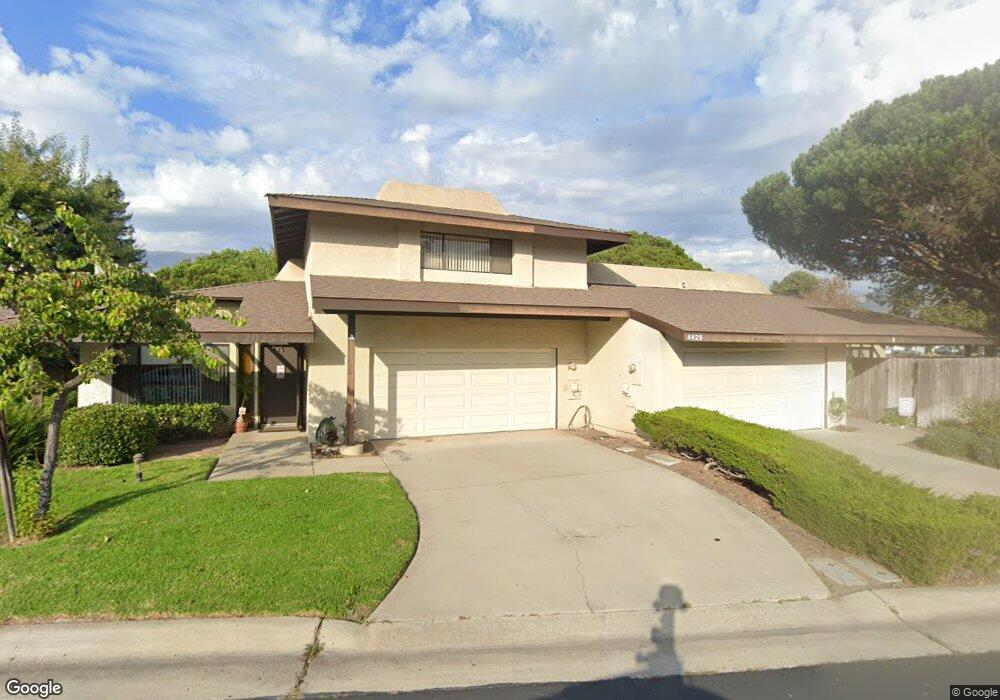
4429 Catlin Cir Unit B Carpinteria, CA 93013
Santa Monica-El Carro NeighborhoodEstimated Value: $851,212 - $982,000
Studio
2
Baths
1,320
Sq Ft
$693/Sq Ft
Est. Value
About This Home
This home is located at 4429 Catlin Cir Unit B, Carpinteria, CA 93013 and is currently estimated at $915,053, approximately $693 per square foot. 4429 Catlin Cir Unit B is a home located in Santa Barbara County with nearby schools including Carpinteria Senior High School and The Howard School.
Ownership History
Date
Name
Owned For
Owner Type
Purchase Details
Closed on
Jul 23, 2014
Sold by
Pollard Michael D
Bought by
M & J Pollard Trust
Current Estimated Value
Create a Home Valuation Report for This Property
The Home Valuation Report is an in-depth analysis detailing your home's value as well as a comparison with similar homes in the area
Home Values in the Area
Average Home Value in this Area
Purchase History
| Date | Buyer | Sale Price | Title Company |
|---|---|---|---|
| M & J Pollard Trust | -- | None Available |
Source: Public Records
Tax History
| Year | Tax Paid | Tax Assessment Tax Assessment Total Assessment is a certain percentage of the fair market value that is determined by local assessors to be the total taxable value of land and additions on the property. | Land | Improvement |
|---|---|---|---|---|
| 2025 | $2,436 | $149,430 | $47,532 | $101,898 |
| 2023 | $2,436 | $143,629 | $45,687 | $97,942 |
| 2022 | $2,335 | $140,814 | $44,792 | $96,022 |
| 2021 | $2,277 | $138,054 | $43,914 | $94,140 |
| 2020 | $2,234 | $136,639 | $43,464 | $93,175 |
| 2019 | $2,178 | $133,961 | $42,612 | $91,349 |
| 2018 | $2,129 | $131,335 | $41,777 | $89,558 |
| 2017 | $2,079 | $128,760 | $40,958 | $87,802 |
| 2016 | $2,043 | $126,236 | $40,155 | $86,081 |
| 2015 | $2,028 | $124,340 | $39,552 | $84,788 |
| 2014 | $1,921 | $121,906 | $38,778 | $83,128 |
Source: Public Records
Map
Nearby Homes
- 4420 Catlin Cir Unit C
- 4501 Carpinteria Ave Unit C
- 4631 Carpinteria Ave
- 4264 Carpinteria Ave Unit 5
- 910 Pear St
- 4677 Carpinteria Ave Unit P
- 4725 9th St Unit 31
- 1350 Tomol St
- 349 Ash Ave Unit Spc 17
- 349 Ash Ave Unit 45
- 4869 Carpinteria Ave
- 4731 4th St
- 635 Elm Ave Unit 1
- 1230 Franciscan Ct Unit 7
- 1255 Franciscan Ct Unit 1
- 180 Holly Ave
- 1260 Cravens Ln Unit 2
- 3080 Foothill Rd
- 4700 Sandyland Rd Unit 23
- 220 Elm Ave Unit 9
- 4429 Catlin Cir
- 4429 Catlin Cir Unit A
- 4403 Catlin Cir Unit B
- 4403 Catlin Cir Unit A
- 4407 Catlin #A Cir Unit A
- 0 Catlin Cir Unit RN-4668
- 4430 Catlin Cir
- 4430 Catlin Cir Unit A
- 4407 Catlin B Cir Unit B
- 4407 Catlin #B Cir Unit B
- 4428 Catlin #A Cir Unit A
- 4428 Catlin Cir Unit 4
- 4428 Catlin Cir Unit B
- 4428 Catlin Cir Unit A
- 4407 Catlin Unit B Cir
- 4425 Catlin Cir Unit A
- 4425 Catlin Cir Unit B
- 4401 Catlin Cir
- 4401 Catlin Cir Unit A
- 4401 Catlin Cir Unit B
Your Personal Tour Guide
Ask me questions while you tour the home.