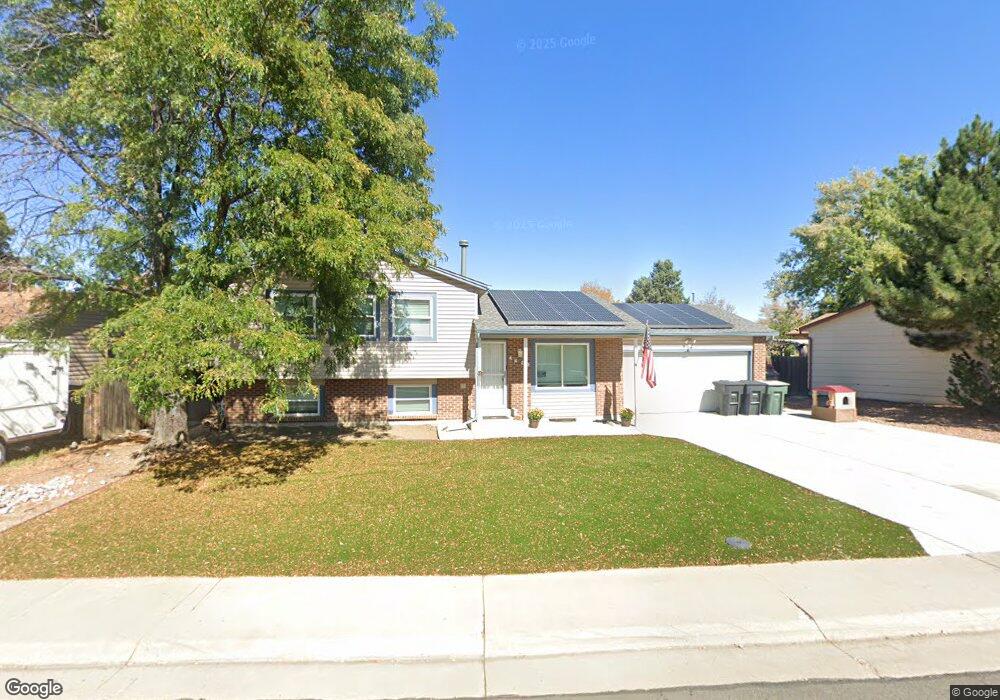
4429 E 118th Ave Thornton, CO 80233
Briar Ridge NeighborhoodEstimated Value: $470,000 - $564,000
5
Beds
2
Baths
2,022
Sq Ft
$250/Sq Ft
Est. Value
About This Home
This home is located at 4429 E 118th Ave, Thornton, CO 80233 and is currently estimated at $504,530, approximately $249 per square foot. 4429 E 118th Ave is a home located in Adams County with nearby schools including Cherry Drive Elementary School, Shadow Ridge Middle School, and Mountain Range High School.
Ownership History
Date
Name
Owned For
Owner Type
Purchase Details
Closed on
Nov 14, 2019
Sold by
Nordby Dale Scott and Nordby Lora
Bought by
Shepple Lacey and Kline Kolin J
Current Estimated Value
Home Financials for this Owner
Home Financials are based on the most recent Mortgage that was taken out on this home.
Original Mortgage
$355,500
Outstanding Balance
$310,351
Interest Rate
3.65%
Mortgage Type
New Conventional
Estimated Equity
$194,179
Purchase Details
Closed on
May 6, 2019
Sold by
Holden Cheryl L
Bought by
Nordby Dale Scott and Nordby Lora
Purchase Details
Closed on
Jan 8, 2002
Sold by
Thurston Darla A
Bought by
Holden Cheryl L
Home Financials for this Owner
Home Financials are based on the most recent Mortgage that was taken out on this home.
Original Mortgage
$189,525
Interest Rate
7.03%
Mortgage Type
FHA
Purchase Details
Closed on
Dec 16, 1998
Sold by
120Th Holly St Llc
Bought by
K A M C O General Partners Llc
Purchase Details
Closed on
Aug 11, 1993
Create a Home Valuation Report for This Property
The Home Valuation Report is an in-depth analysis detailing your home's value as well as a comparison with similar homes in the area
Home Values in the Area
Average Home Value in this Area
Purchase History
| Date | Buyer | Sale Price | Title Company |
|---|---|---|---|
| Shepple Lacey | $395,000 | Heritage Title Company | |
| Nordby Dale Scott | $247,000 | Heritage Title Co | |
| Holden Cheryl L | $192,500 | First American Heritage Titl | |
| K A M C O General Partners Llc | $31,359 | Land Title | |
| -- | -- | -- |
Source: Public Records
Mortgage History
| Date | Status | Borrower | Loan Amount |
|---|---|---|---|
| Open | Shepple Lacey | $355,500 | |
| Previous Owner | Holden Cheryl L | $189,525 |
Source: Public Records
Tax History
| Year | Tax Paid | Tax Assessment Tax Assessment Total Assessment is a certain percentage of the fair market value that is determined by local assessors to be the total taxable value of land and additions on the property. | Land | Improvement |
|---|---|---|---|---|
| 2025 | $3,375 | $34,750 | $6,600 | $28,150 |
| 2024 | $3,375 | $31,940 | $6,060 | $25,880 |
| 2023 | $3,341 | $36,330 | $6,090 | $30,240 |
| 2022 | $2,724 | $24,730 | $5,770 | $18,960 |
| 2021 | $2,815 | $24,730 | $5,770 | $18,960 |
| 2020 | $2,508 | $22,480 | $5,930 | $16,550 |
| 2019 | $2,513 | $22,480 | $5,930 | $16,550 |
| 2018 | $2,102 | $18,270 | $6,840 | $11,430 |
| 2017 | $1,911 | $18,270 | $6,840 | $11,430 |
| 2016 | $1,678 | $15,610 | $3,180 | $12,430 |
| 2015 | $1,675 | $15,610 | $3,180 | $12,430 |
| 2014 | -- | $13,160 | $2,310 | $10,850 |
Source: Public Records
Map
Nearby Homes
- 4402 E 117th Ct
- 4875 E 117th Dr
- 5005 E 117th Ave
- 11731 Ash St
- 4220 E 119th Place Unit B
- 11725 Forest Ct
- 4160 E 119th Place Unit B
- 5155 E 117th Dr
- 4145 E 119th Place Unit B
- 11981 Bellaire St Unit D
- 5080 E 120th Place
- 11961 Bellaire St Unit C
- 5141 E 116th Ave
- 5211 E 119th Ct
- 5243 E 119th Way
- 5160 E 120th Place
- 11918 Glencoe Dr
- 11867 Jackson Cir
- 12152 Dahlia Dr
- 12099 Forest St
- 4417 E 118th Ave
- 4451 E 118th Ave
- 4463 E 118th Ave
- 4405 E 118th Ave
- 4416 E 118th Ave
- 4450 E 118th Ave
- 4404 E 118th Ave
- 4485 E 118th Ave
- 4462 E 118th Ave
- 4413 E 117th Ct
- 4403 E 117th Ct
- 4484 E 118th Ave
- 4465 E 117th Ave
- 4497 E 118th Ave
- 11801 Birch Dr
- 4453 E 117th Ave
- 4422 E 117th Ct
- 4390 E 118th Ave
- 11806 Birch Dr
- 4496 E 118th Ave
Your Personal Tour Guide
Ask me questions while you tour the home.