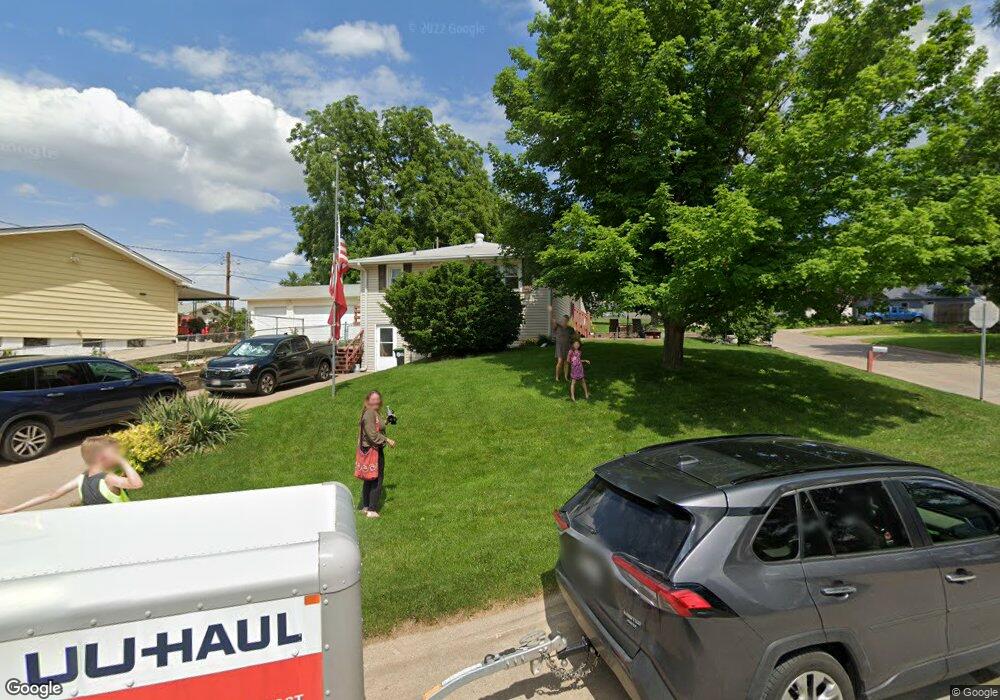
4429 S 48th Ave Omaha, NE 68117
South Central Omaha NeighborhoodEstimated Value: $186,000 - $241,000
3
Beds
2
Baths
1,064
Sq Ft
$202/Sq Ft
Est. Value
About This Home
This home is located at 4429 S 48th Ave, Omaha, NE 68117 and is currently estimated at $215,071, approximately $202 per square foot. 4429 S 48th Ave is a home located in Douglas County with nearby schools including Ashland Park-Robbins Elementary School, St Thomas More School, and St. Peter Claver Christo Rey High School.
Ownership History
Date
Name
Owned For
Owner Type
Purchase Details
Closed on
Mar 5, 2025
Sold by
Lyons Colin and Lyons Christina
Bought by
C4 Holdings Llc
Current Estimated Value
Purchase Details
Closed on
Nov 25, 2024
Sold by
C4 Holdings Llc
Bought by
Lyons Colin
Home Financials for this Owner
Home Financials are based on the most recent Mortgage that was taken out on this home.
Original Mortgage
$120,000
Interest Rate
6.54%
Mortgage Type
New Conventional
Purchase Details
Closed on
Nov 7, 2022
Sold by
Williams James C and Williams Linda L
Bought by
C4 Holdings Llc
Create a Home Valuation Report for This Property
The Home Valuation Report is an in-depth analysis detailing your home's value as well as a comparison with similar homes in the area
Home Values in the Area
Average Home Value in this Area
Purchase History
| Date | Buyer | Sale Price | Title Company |
|---|---|---|---|
| C4 Holdings Llc | -- | None Listed On Document | |
| Lyons Colin | $2,222 | None Listed On Document | |
| Lyons Colin | $2,222 | None Listed On Document | |
| C4 Holdings Llc | $155,000 | Nebraska Title |
Source: Public Records
Mortgage History
| Date | Status | Borrower | Loan Amount |
|---|---|---|---|
| Previous Owner | Lyons Colin | $120,000 |
Source: Public Records
Tax History Compared to Growth
Tax History
| Year | Tax Paid | Tax Assessment Tax Assessment Total Assessment is a certain percentage of the fair market value that is determined by local assessors to be the total taxable value of land and additions on the property. | Land | Improvement |
|---|---|---|---|---|
| 2024 | $3,481 | $165,000 | $15,600 | $149,400 |
| 2023 | $3,481 | $165,000 | $15,600 | $149,400 |
| 2022 | $3,343 | $156,600 | $10,000 | $146,600 |
| 2021 | $2,540 | $120,000 | $10,000 | $110,000 |
| 2020 | $2,569 | $120,000 | $10,000 | $110,000 |
| 2019 | $2,392 | $111,400 | $15,500 | $95,900 |
| 2018 | $2,395 | $111,400 | $15,500 | $95,900 |
| 2017 | $2,124 | $98,300 | $6,900 | $91,400 |
| 2016 | $2,109 | $98,300 | $6,900 | $91,400 |
| 2015 | $2,081 | $98,300 | $6,900 | $91,400 |
| 2014 | $2,081 | $98,300 | $6,900 | $91,400 |
Source: Public Records
Map
Nearby Homes