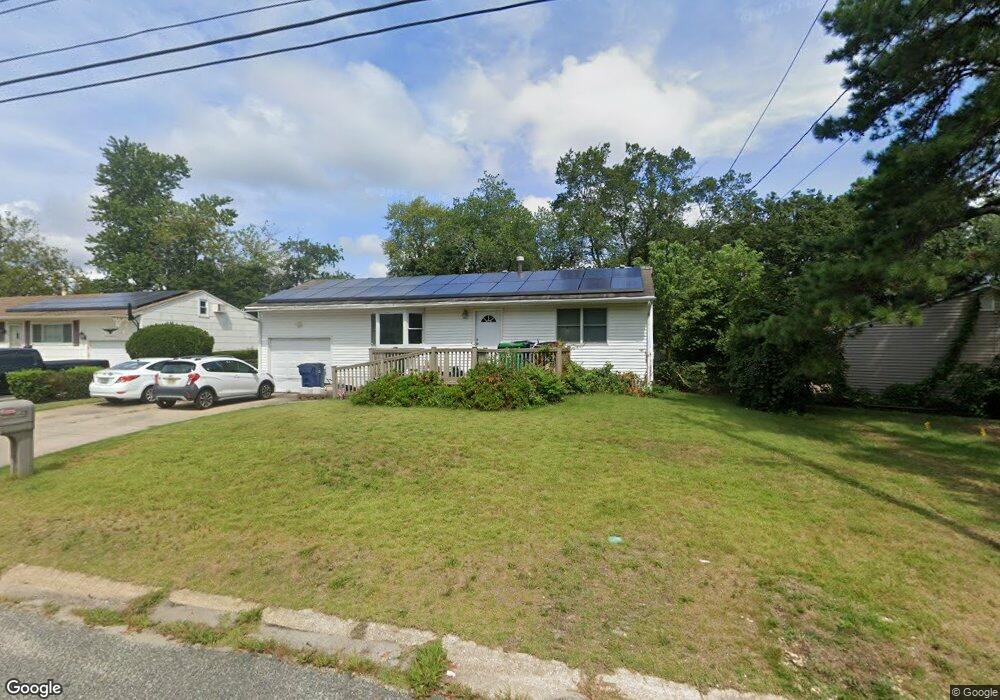
443 Alfred Rd Toms River, NJ 08757
Estimated Value: $317,397 - $362,000
3
Beds
1
Bath
1,728
Sq Ft
$201/Sq Ft
Est. Value
About This Home
This home is located at 443 Alfred Rd, Toms River, NJ 08757 and is currently estimated at $347,099, approximately $200 per square foot. 443 Alfred Rd is a home located in Ocean County with nearby schools including St Joseph Grade School, Ambassador Christian Academy, and Ocean Academy.
Ownership History
Date
Name
Owned For
Owner Type
Purchase Details
Closed on
Jun 29, 2005
Sold by
Campanile Robyn A
Bought by
Campanile Joseph and Campanile Robyn A
Current Estimated Value
Purchase Details
Closed on
Jun 29, 2001
Sold by
Baynes Edward
Bought by
Camanile Joseph and Camanile Robyn
Home Financials for this Owner
Home Financials are based on the most recent Mortgage that was taken out on this home.
Original Mortgage
$95,200
Interest Rate
7.2%
Mortgage Type
FHA
Create a Home Valuation Report for This Property
The Home Valuation Report is an in-depth analysis detailing your home's value as well as a comparison with similar homes in the area
Home Values in the Area
Average Home Value in this Area
Purchase History
| Date | Buyer | Sale Price | Title Company |
|---|---|---|---|
| Campanile Joseph | -- | Clear Advantage Title | |
| Camanile Joseph | $96,000 | -- |
Source: Public Records
Mortgage History
| Date | Status | Borrower | Loan Amount |
|---|---|---|---|
| Previous Owner | Camanile Joseph | $95,200 |
Source: Public Records
Tax History Compared to Growth
Tax History
| Year | Tax Paid | Tax Assessment Tax Assessment Total Assessment is a certain percentage of the fair market value that is determined by local assessors to be the total taxable value of land and additions on the property. | Land | Improvement |
|---|---|---|---|---|
| 2025 | $5,461 | $166,200 | $65,100 | $101,100 |
| 2024 | $5,269 | $166,200 | $65,100 | $101,100 |
| 2023 | $5,134 | $166,200 | $65,100 | $101,100 |
| 2022 | $5,134 | $166,200 | $65,100 | $101,100 |
| 2021 | $5,091 | $166,200 | $65,100 | $101,100 |
| 2020 | $4,961 | $166,200 | $65,100 | $101,100 |
| 2019 | $4,913 | $166,200 | $65,100 | $101,100 |
| 2018 | $4,825 | $166,200 | $65,100 | $101,100 |
| 2017 | $4,758 | $166,200 | $65,100 | $101,100 |
| 2016 | $4,644 | $166,200 | $65,100 | $101,100 |
| 2015 | $4,604 | $210,900 | $100,000 | $110,900 |
| 2014 | $4,431 | $210,900 | $100,000 | $110,900 |
Source: Public Records
Map
Nearby Homes