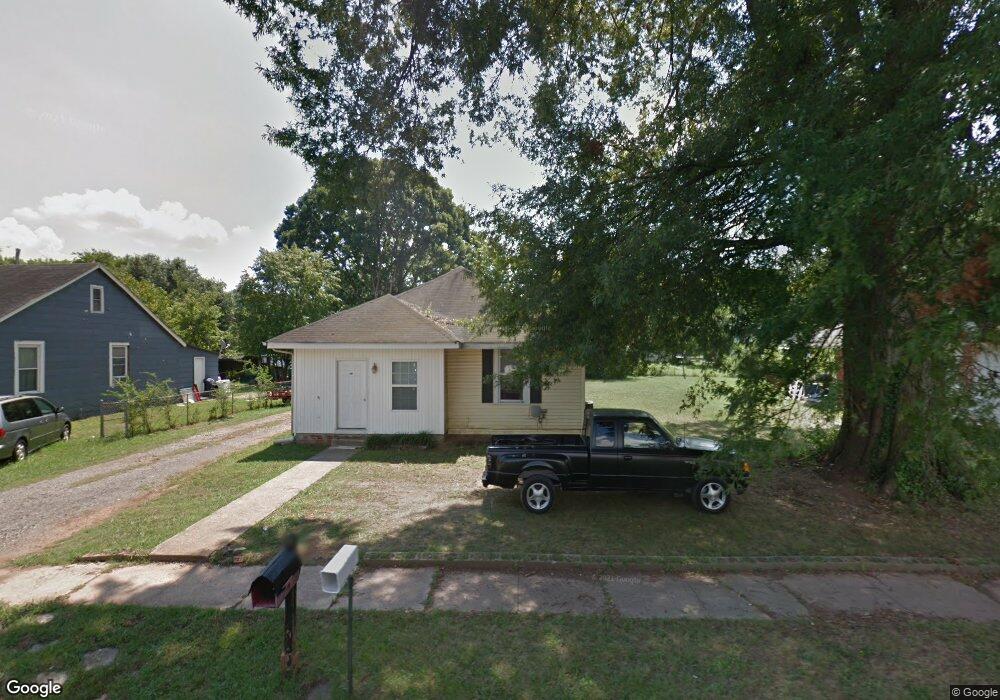
443 Birch St Dalton, GA 30720
Estimated Value: $135,000 - $194,000
--
Bed
1
Bath
990
Sq Ft
$152/Sq Ft
Est. Value
About This Home
This home is located at 443 Birch St, Dalton, GA 30720 and is currently estimated at $150,642, approximately $152 per square foot. 443 Birch St is a home located in Whitfield County with nearby schools including Brookwood Elementary School, Dalton Middle School, and Dalton High School.
Ownership History
Date
Name
Owned For
Owner Type
Purchase Details
Closed on
Jun 8, 2018
Sold by
Yim Alice W G
Bought by
Hurtado Ubaldo Rodriguez and Casteneda Anabel Zarzona
Current Estimated Value
Home Financials for this Owner
Home Financials are based on the most recent Mortgage that was taken out on this home.
Original Mortgage
$70,000
Outstanding Balance
$22,479
Interest Rate
4.5%
Mortgage Type
New Conventional
Estimated Equity
$128,163
Purchase Details
Closed on
Jun 1, 1997
Bought by
Yim Alice W G and Chang Bin
Create a Home Valuation Report for This Property
The Home Valuation Report is an in-depth analysis detailing your home's value as well as a comparison with similar homes in the area
Home Values in the Area
Average Home Value in this Area
Purchase History
| Date | Buyer | Sale Price | Title Company |
|---|---|---|---|
| Hurtado Ubaldo Rodriguez | $70,000 | -- | |
| Yim Alice W G | $39,000 | -- |
Source: Public Records
Mortgage History
| Date | Status | Borrower | Loan Amount |
|---|---|---|---|
| Open | Hurtado Ubaldo Rodriguez | $70,000 |
Source: Public Records
Tax History Compared to Growth
Tax History
| Year | Tax Paid | Tax Assessment Tax Assessment Total Assessment is a certain percentage of the fair market value that is determined by local assessors to be the total taxable value of land and additions on the property. | Land | Improvement |
|---|---|---|---|---|
| 2024 | $738 | $50,764 | $7,600 | $43,164 |
| 2023 | $738 | $31,509 | $4,800 | $26,709 |
| 2022 | $432 | $23,209 | $2,940 | $20,269 |
| 2021 | $432 | $23,209 | $2,940 | $20,269 |
| 2020 | $436 | $23,209 | $2,940 | $20,269 |
| 2019 | $376 | $21,237 | $2,940 | $18,297 |
| 2018 | $506 | $16,062 | $2,940 | $13,122 |
| 2017 | $506 | $16,062 | $2,940 | $13,122 |
| 2016 | $454 | $14,969 | $2,940 | $12,029 |
| 2014 | $530 | $19,676 | $2,940 | $16,736 |
| 2013 | -- | $19,676 | $2,940 | $16,736 |
Source: Public Records
Map
Nearby Homes