443 C St Creswell, OR 97426
Estimated Value: $445,000 - $493,000
4
Beds
2
Baths
2,648
Sq Ft
$178/Sq Ft
Est. Value
About This Home
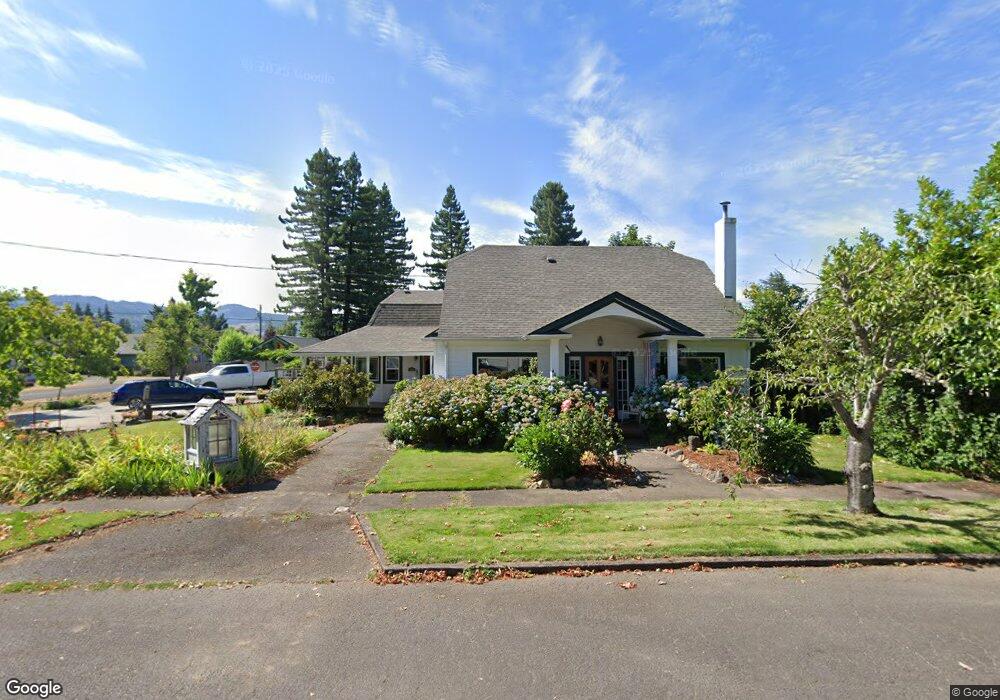
This home is located at 443 C St, Creswell, OR 97426 and is currently estimated at $471,397, approximately $178 per square foot. 443 C St is a home located in Lane County with nearby schools including Creslane Elementary School, Creswell Middle School, and Creswell High School.
Ownership History
Date
Name
Owned For
Owner Type
Purchase Details
Closed on
Aug 25, 2020
Sold by
Bennion Timothy K and Bennion Lisa M
Bought by
Bennion Timothy K and Bennion Lisa M
Current Estimated Value
Purchase Details
Closed on
Oct 5, 1998
Sold by
Wright Randy E and Wright Jenny L
Bought by
Bennion Timothy K and Bennion Lisa M
Home Financials for this Owner
Home Financials are based on the most recent Mortgage that was taken out on this home.
Original Mortgage
$139,850
Outstanding Balance
$29,074
Interest Rate
6.88%
Estimated Equity
$442,323
Create a Home Valuation Report for This Property
The Home Valuation Report is an in-depth analysis detailing your home's value as well as a comparison with similar homes in the area
Home Values in the Area
Average Home Value in this Area
Purchase History
| Date | Buyer | Sale Price | Title Company |
|---|---|---|---|
| Bennion Timothy K | -- | None Available | |
| Bennion Timothy K | $155,400 | Fidelity National Title Ins |
Source: Public Records
Mortgage History
| Date | Status | Borrower | Loan Amount |
|---|---|---|---|
| Open | Bennion Timothy K | $139,850 |
Source: Public Records
Tax History Compared to Growth
Tax History
| Year | Tax Paid | Tax Assessment Tax Assessment Total Assessment is a certain percentage of the fair market value that is determined by local assessors to be the total taxable value of land and additions on the property. | Land | Improvement |
|---|---|---|---|---|
| 2025 | $4,100 | $249,835 | -- | -- |
| 2024 | $3,067 | $242,559 | -- | -- |
| 2023 | $3,067 | $235,495 | $0 | $0 |
| 2022 | $3,303 | $228,636 | $0 | $0 |
| 2021 | $3,191 | $221,977 | $0 | $0 |
| 2020 | $3,147 | $215,512 | $0 | $0 |
| 2019 | $3,077 | $209,235 | $0 | $0 |
| 2018 | $3,034 | $197,224 | $0 | $0 |
| 2017 | $2,943 | $197,224 | $0 | $0 |
| 2016 | $3,014 | $191,480 | $0 | $0 |
| 2015 | $2,906 | $185,903 | $0 | $0 |
| 2014 | $2,881 | $180,488 | $0 | $0 |
Source: Public Records
Map
Nearby Homes
- 589 Mary Neal Ln
- 521 S 7th St
- 0 Holbrook Ln Unit 339588620
- 368 Hillegas Ave
- 1 Queens Ave Unit 1
- 645 Boulder Loop
- 156 N 1st St
- 692 N 1st St
- 689 Blue Jay Loop
- 460 Meadow Ln
- 700 N Mill St Unit 109
- 700 N Mill St
- 83354 N Pacific Hwy
- 491 Ironwood Loop
- 33465 Irish Ln
- 32968 Camas Swale Rd
- 375 Sunday Dr
- 316 Sunday Dr
- 336 Sunday Dr
- 685 St Andrews Loop