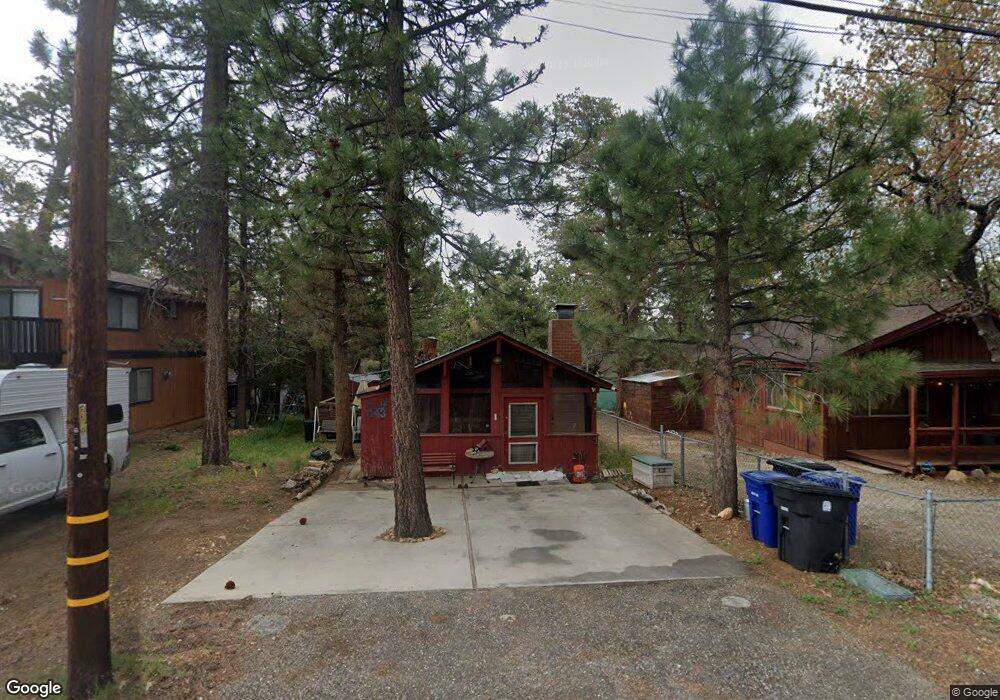
443 Cedar Ln Sugarloaf, CA 92386
Estimated Value: $231,400 - $312,000
2
Beds
1
Bath
702
Sq Ft
$376/Sq Ft
Est. Value
About This Home
This home is located at 443 Cedar Ln, Sugarloaf, CA 92386 and is currently estimated at $264,100, approximately $376 per square foot. 443 Cedar Ln is a home with nearby schools including Baldwin Lane Elementary School, Big Bear Middle School, and Big Bear High School.
Ownership History
Date
Name
Owned For
Owner Type
Purchase Details
Closed on
Jul 10, 2000
Sold by
Cortez Dianna L
Bought by
Ochoa Ana Maria
Current Estimated Value
Home Financials for this Owner
Home Financials are based on the most recent Mortgage that was taken out on this home.
Original Mortgage
$55,046
Outstanding Balance
$19,586
Interest Rate
8.15%
Mortgage Type
FHA
Estimated Equity
$244,514
Purchase Details
Closed on
Nov 24, 1999
Sold by
Delia Vincent Jim
Bought by
Ditzler Julia E
Home Financials for this Owner
Home Financials are based on the most recent Mortgage that was taken out on this home.
Original Mortgage
$17,200
Interest Rate
7.95%
Mortgage Type
Purchase Money Mortgage
Purchase Details
Closed on
Nov 22, 1999
Sold by
Cortez Adolfo
Bought by
Cortez Dianna L
Home Financials for this Owner
Home Financials are based on the most recent Mortgage that was taken out on this home.
Original Mortgage
$17,200
Interest Rate
7.95%
Mortgage Type
Purchase Money Mortgage
Create a Home Valuation Report for This Property
The Home Valuation Report is an in-depth analysis detailing your home's value as well as a comparison with similar homes in the area
Home Values in the Area
Average Home Value in this Area
Purchase History
| Date | Buyer | Sale Price | Title Company |
|---|---|---|---|
| Ochoa Ana Maria | $55,500 | Commonwealth Land Title Co | |
| Ditzler Julia E | -- | Fidelity National Title Co | |
| Cortez Dianna L | -- | Fidelity National Title Co | |
| Ditzler Julia E | -- | Fidelity National Title Co |
Source: Public Records
Mortgage History
| Date | Status | Borrower | Loan Amount |
|---|---|---|---|
| Open | Ochoa Ana Maria | $55,046 | |
| Previous Owner | Ditzler Julia E | $17,200 | |
| Closed | Ochoa Ana Maria | $3,330 |
Source: Public Records
Tax History
| Year | Tax Paid | Tax Assessment Tax Assessment Total Assessment is a certain percentage of the fair market value that is determined by local assessors to be the total taxable value of land and additions on the property. | Land | Improvement |
|---|---|---|---|---|
| 2025 | $2,246 | $82,876 | $22,600 | $60,276 |
| 2024 | $2,129 | $81,251 | $22,157 | $59,094 |
| 2023 | $2,040 | $79,658 | $21,723 | $57,935 |
| 2022 | $1,941 | $78,096 | $21,297 | $56,799 |
| 2021 | $1,889 | $76,564 | $20,879 | $55,685 |
| 2020 | $1,866 | $75,779 | $20,665 | $55,114 |
| 2019 | $1,824 | $74,293 | $20,260 | $54,033 |
| 2018 | $1,752 | $72,837 | $19,863 | $52,974 |
| 2017 | $1,698 | $71,409 | $19,474 | $51,935 |
| 2016 | $1,652 | $70,009 | $19,092 | $50,917 |
| 2015 | $1,618 | $68,957 | $18,805 | $50,152 |
| 2014 | $1,585 | $67,607 | $18,437 | $49,170 |
Source: Public Records
Map
Nearby Homes
- 497 Cedar Ln
- 0 Spruce Ln Unit 32501909
- 0 Spruce Ln Unit IG25167820
- 0 Spruce Ln Unit IG25167795
- 478 Cedar Ln
- 854 Cedar Ln
- 417 Spruce Ln
- 428 Maple Ln
- 390 Spruce Ln
- 573 Spruce Ln
- 446 Moreno Ln
- 1086 Heritage Trail
- 548 Moreno Ln
- 332 Cedar Ln
- 317 Spruce Ln
- 560 Highland Ln
- 568 Highland Ln
- 564 Highland Ln
- 44667 Barton Ln
- 630 Victoria Ln
Your Personal Tour Guide
Ask me questions while you tour the home.