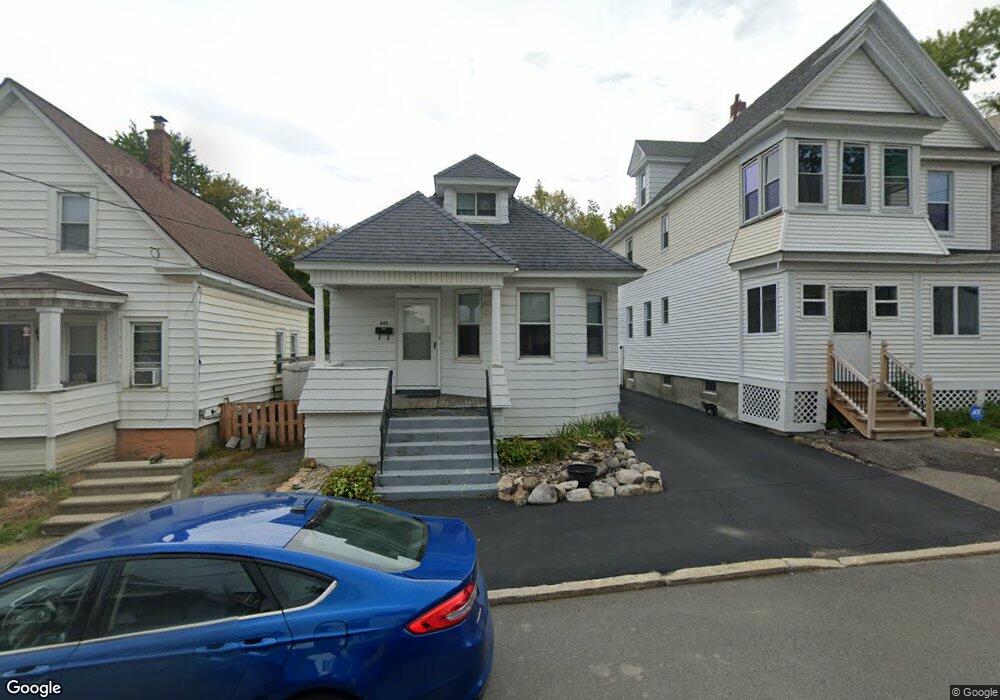
443 Clarendon St Schenectady, NY 12308
Estimated Value: $121,000 - $167,764
2
Beds
1
Bath
954
Sq Ft
$159/Sq Ft
Est. Value
About This Home
This home is located at 443 Clarendon St, Schenectady, NY 12308 and is currently estimated at $151,441, approximately $158 per square foot. 443 Clarendon St is a home located in Schenectady County with nearby schools including Yates Elementary School, Oneida Middle School, and Schenectady High School.
Ownership History
Date
Name
Owned For
Owner Type
Purchase Details
Closed on
Jan 21, 2025
Sold by
Harris Timothy R
Bought by
Timothy Russell Harris 2025 Irrevocable Trust and Allen
Current Estimated Value
Purchase Details
Closed on
Oct 6, 2009
Sold by
Susao Michael
Bought by
Harris Timothy A
Home Financials for this Owner
Home Financials are based on the most recent Mortgage that was taken out on this home.
Original Mortgage
$61,650
Interest Rate
5.14%
Mortgage Type
New Conventional
Purchase Details
Closed on
Jan 27, 2009
Sold by
U S Bank National Association
Bought by
Fusco Michael
Purchase Details
Closed on
Oct 10, 2008
Sold by
Hill James
Bought by
U S Bank
Purchase Details
Closed on
Nov 1, 2002
Create a Home Valuation Report for This Property
The Home Valuation Report is an in-depth analysis detailing your home's value as well as a comparison with similar homes in the area
Home Values in the Area
Average Home Value in this Area
Purchase History
| Date | Buyer | Sale Price | Title Company |
|---|---|---|---|
| Timothy Russell Harris 2025 Irrevocable Trust | -- | None Listed On Document | |
| Timothy Russell Harris 2025 Irrevocable Trust | -- | None Listed On Document | |
| Harris Timothy A | $64,900 | Oconnor | |
| Harris Timothy R | $65,000 | None Available | |
| Fusco Michael | $37,500 | None Available | |
| U S Bank | $49,500 | -- | |
| -- | $27,500 | -- |
Source: Public Records
Mortgage History
| Date | Status | Borrower | Loan Amount |
|---|---|---|---|
| Previous Owner | Harris Timothy R | $61,650 |
Source: Public Records
Tax History Compared to Growth
Tax History
| Year | Tax Paid | Tax Assessment Tax Assessment Total Assessment is a certain percentage of the fair market value that is determined by local assessors to be the total taxable value of land and additions on the property. | Land | Improvement |
|---|---|---|---|---|
| 2024 | $2,820 | $60,700 | $9,100 | $51,600 |
| 2023 | $2,820 | $60,700 | $9,100 | $51,600 |
| 2022 | $2,675 | $60,700 | $9,100 | $51,600 |
| 2021 | $2,597 | $60,700 | $9,100 | $51,600 |
| 2020 | $2,501 | $60,700 | $9,100 | $51,600 |
| 2019 | $1,896 | $60,700 | $9,100 | $51,600 |
| 2018 | $2,463 | $60,700 | $9,100 | $51,600 |
| 2017 | $2,168 | $60,700 | $9,100 | $51,600 |
| 2016 | $2,572 | $60,700 | $9,100 | $51,600 |
| 2015 | -- | $60,700 | $9,100 | $51,600 |
| 2014 | -- | $60,700 | $9,100 | $51,600 |
Source: Public Records
Map
Nearby Homes
- 431 Clarendon St
- 1857 Foster Ave
- 1695 Foster Ave
- 561 Clarendon St
- 1813 Avenue A
- 550 Gerling St
- 1636 Foster Ave
- 312 Harborside Dr
- 629 Lang St
- 733 Mason St
- 633 Lang St
- 1687 Avenue A
- 1600 Carrie St
- 1605 van Vranken Ave
- 1594 Carrie St
- 1588 Foster Ave
- L1 Lenox Rd
- 2034 Avenue A
- 1818 Lenox Rd
- 910 Gerling St
- 439 Clarendon St
- 447 Clarendon St
- 435 Clarendon St
- 451 Clarendon St
- 440 Manhattan St
- 452 Manhattan St
- 436 Manhattan St
- 427 Clarendon St
- 448 Clarendon St
- 444 Clarendon St
- 456 Manhattan St
- 440 Clarendon St
- 448 Manhattan St
- 436 Clarendon St
- 428 Clarendon St
- 1861 Foster Ave
- 432 Clarendon St
- 1813 Foster Ave
- 1815 Foster Ave
- 1875 Foster Ave