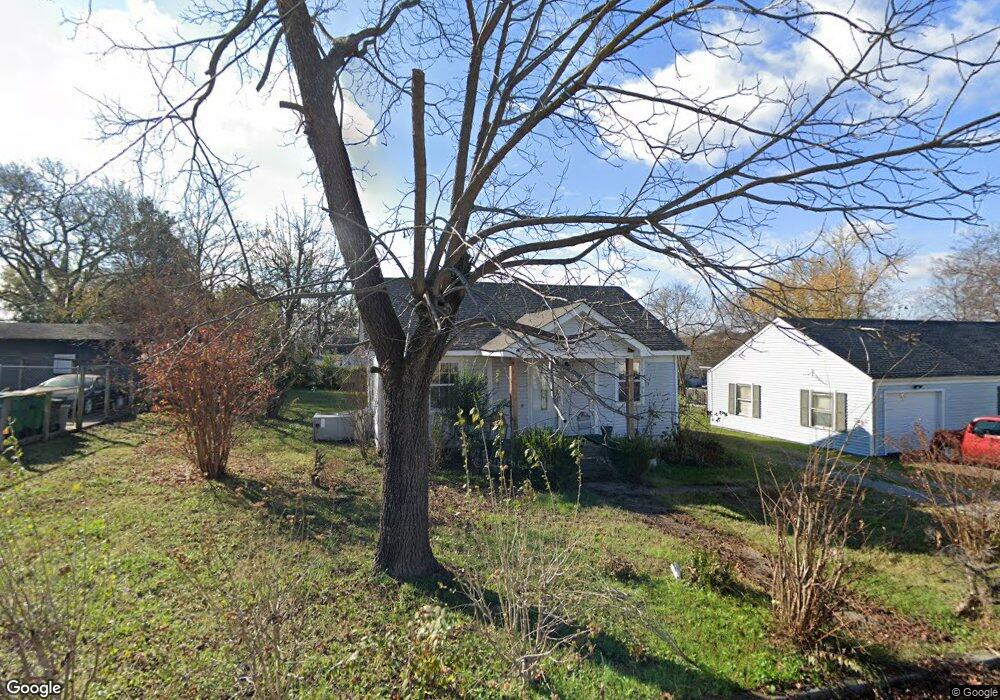
443 Coleman St Lewisburg, TN 37091
Estimated Value: $129,427 - $186,000
--
Bed
1
Bath
803
Sq Ft
$201/Sq Ft
Est. Value
About This Home
This home is located at 443 Coleman St, Lewisburg, TN 37091 and is currently estimated at $161,107, approximately $200 per square foot. 443 Coleman St is a home located in Marshall County with nearby schools including Marshall Elementary School, Oak Grove Elementary School, and Westhills Elementary School.
Ownership History
Date
Name
Owned For
Owner Type
Purchase Details
Closed on
Jan 15, 2021
Sold by
Gonzalez Jesus Estrada
Bought by
Morales Estrada Guadalupe
Current Estimated Value
Purchase Details
Closed on
Mar 11, 2008
Sold by
Coble William H and Coble Marsh
Bought by
Estrada Gonzalez Jesus
Purchase Details
Closed on
Feb 28, 2008
Sold by
James Delapaz Melquiades
Bought by
Coble William H and Coble Marsha
Purchase Details
Closed on
May 23, 2003
Sold by
William Coble and William Marsha
Bought by
Jaimes Delapaz Melquiades
Purchase Details
Closed on
Aug 28, 2001
Sold by
Hunter Amye L
Bought by
Coble William H and Coble Marsh
Purchase Details
Closed on
Dec 15, 2000
Sold by
David Jent
Bought by
Hunter Amye L
Purchase Details
Closed on
Aug 21, 2000
Sold by
Faber Castell Corp
Bought by
David Jent
Purchase Details
Closed on
Jun 21, 1990
Bought by
Faber Castell Corp
Create a Home Valuation Report for This Property
The Home Valuation Report is an in-depth analysis detailing your home's value as well as a comparison with similar homes in the area
Home Values in the Area
Average Home Value in this Area
Purchase History
| Date | Buyer | Sale Price | Title Company |
|---|---|---|---|
| Morales Estrada Guadalupe | -- | None Available | |
| Estrada Gonzalez Jesus | $53,000 | -- | |
| Coble William H | $48,820 | -- | |
| Jaimes Delapaz Melquiades | $54,000 | -- | |
| Coble William H | $56,471 | -- | |
| Hunter Amye L | $55,500 | -- | |
| David Jent | $58,000 | -- | |
| Faber Castell Corp | $25,000 | -- |
Source: Public Records
Tax History Compared to Growth
Tax History
| Year | Tax Paid | Tax Assessment Tax Assessment Total Assessment is a certain percentage of the fair market value that is determined by local assessors to be the total taxable value of land and additions on the property. | Land | Improvement |
|---|---|---|---|---|
| 2024 | -- | $17,750 | $3,125 | $14,625 |
| 2023 | $551 | $17,750 | $3,125 | $14,625 |
| 2022 | $551 | $17,750 | $3,125 | $14,625 |
| 2021 | $520 | $11,175 | $2,250 | $8,925 |
| 2020 | $554 | $11,175 | $2,250 | $8,925 |
| 2019 | $537 | $11,925 | $2,250 | $9,675 |
| 2018 | $531 | $11,925 | $2,250 | $9,675 |
| 2017 | $531 | $11,925 | $2,250 | $9,675 |
| 2016 | $577 | $11,275 | $2,125 | $9,150 |
| 2015 | $527 | $11,275 | $2,125 | $9,150 |
| 2014 | $516 | $11,050 | $2,125 | $8,925 |
Source: Public Records
Map
Nearby Homes