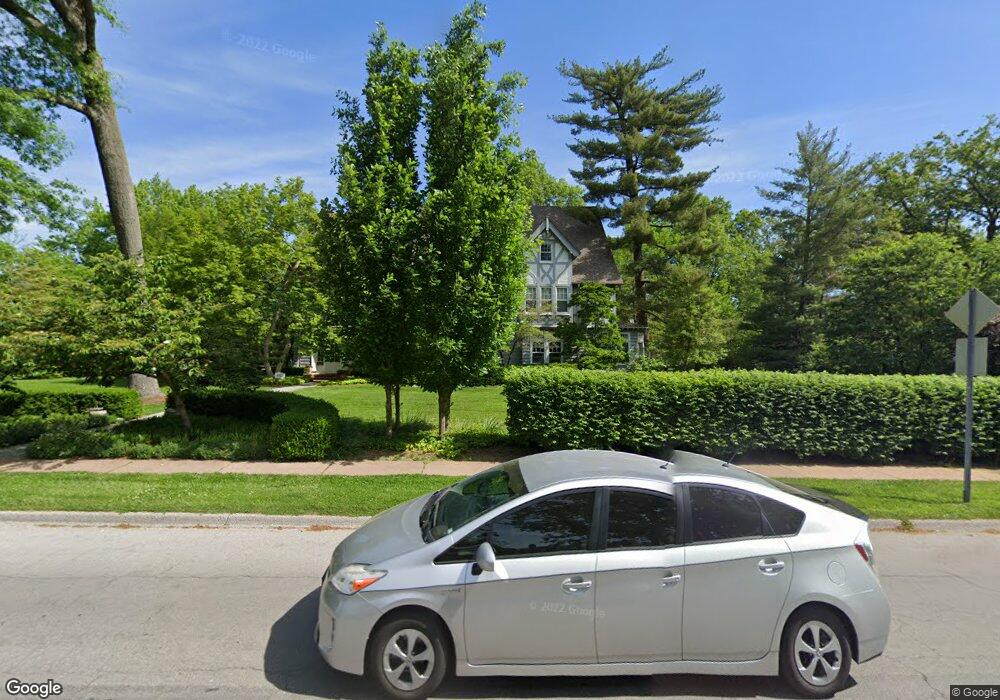
443 E Argonne Dr Saint Louis, MO 63122
Estimated Value: $1,469,000 - $3,111,821
6
Beds
6
Baths
7,566
Sq Ft
$323/Sq Ft
Est. Value
About This Home
This home is located at 443 E Argonne Dr, Saint Louis, MO 63122 and is currently estimated at $2,443,955, approximately $323 per square foot. 443 E Argonne Dr is a home located in St. Louis County with nearby schools including F.P. Tillman Elementary School, Nipher Middle School, and Kirkwood Senior High School.
Ownership History
Date
Name
Owned For
Owner Type
Purchase Details
Closed on
Jun 21, 2021
Sold by
443 East Argonne Llc
Bought by
Sprong Douglas R and Sprong Kathleen D
Current Estimated Value
Purchase Details
Closed on
Jun 21, 2018
Sold by
443 East Argonne Llc
Bought by
Sprong Douglas R and Sprong Kathleen D
Purchase Details
Closed on
Jun 4, 2007
Sold by
Sprong Kathleen D and Sprong Douglas R
Bought by
443 East Argonne Llc
Purchase Details
Closed on
Nov 3, 2003
Sold by
Sprong Kathleen D and Sprong Douglas R
Bought by
443 East Argonne Llc
Purchase Details
Closed on
Aug 1, 2002
Sold by
Sansone Margaret Ann
Bought by
Sprong Douglas R and Sprong Kathleen
Home Financials for this Owner
Home Financials are based on the most recent Mortgage that was taken out on this home.
Original Mortgage
$650,000
Interest Rate
6.53%
Purchase Details
Closed on
Aug 31, 1999
Sold by
Sansone Margaret Ann
Bought by
Sansone Margaret Ann and Margaret Ann Sansone Revocable Living Tr
Create a Home Valuation Report for This Property
The Home Valuation Report is an in-depth analysis detailing your home's value as well as a comparison with similar homes in the area
Home Values in the Area
Average Home Value in this Area
Purchase History
| Date | Buyer | Sale Price | Title Company |
|---|---|---|---|
| Sprong Douglas R | -- | None Available | |
| Sprong Douglas R | -- | None Listed On Document | |
| 443 East Argonne Llc | -- | None Available | |
| Sprong Kathleen D | -- | None Available | |
| 443 East Argonne Llc | -- | -- | |
| Sprong Kathleen D | -- | -- | |
| Sprong Douglas R | $1,100,000 | -- | |
| Sansone Margaret Ann | -- | -- | |
| Sansone Margaret Ann | -- | -- |
Source: Public Records
Mortgage History
| Date | Status | Borrower | Loan Amount |
|---|---|---|---|
| Previous Owner | Sprong Douglas R | $650,000 |
Source: Public Records
Tax History
| Year | Tax Paid | Tax Assessment Tax Assessment Total Assessment is a certain percentage of the fair market value that is determined by local assessors to be the total taxable value of land and additions on the property. | Land | Improvement |
|---|---|---|---|---|
| 2025 | $21,242 | $340,100 | $122,720 | $217,380 |
| 2024 | $21,242 | $340,100 | $110,450 | $229,650 |
| 2023 | $21,242 | $340,100 | $110,450 | $229,650 |
| 2022 | $19,078 | $267,540 | $103,550 | $163,990 |
| 2021 | $18,691 | $290,020 | $103,550 | $186,470 |
| 2020 | $19,432 | $290,010 | $91,120 | $198,890 |
| 2019 | $19,636 | $290,010 | $91,120 | $198,890 |
| 2018 | $14,787 | $192,810 | $46,470 | $146,340 |
| 2017 | $14,768 | $192,810 | $46,470 | $146,340 |
| 2016 | $13,333 | $175,420 | $41,720 | $133,700 |
| 2015 | $13,315 | $175,420 | $41,720 | $133,700 |
| 2014 | $15,124 | $194,990 | $37,540 | $157,450 |
Source: Public Records
Map
Nearby Homes
- 430 E Jefferson Ave
- 534 E Jefferson Ave
- 306 E Jefferson Ave
- 231 E Argonne Dr
- 132 E Monroe Ave Unit C-103
- 132 E Monroe Ave Unit 211
- 132 E Monroe Ave Unit E-106
- 132 E Monroe Ave Unit C-307
- 132 E Monroe Ave Unit 305
- 132 E Monroe Ave Unit 302
- 132 E Monroe Ave Unit 308
- 132 E Monroe Ave Unit 212
- 132 E Monroe Ave Unit A-102
- 132 E Monroe Ave Unit D-311
- 132 E Monroe Ave Unit 201
- 200 S Kirkwood Rd Unit 317
- 361 E Bodley Ave
- 412 Hawbrook Ct
- 127 E Clinton Place Unit 1B
- 115 E Washington Ave Unit 2N
- 111 N Woodlawn Ave
- 419 E Argonne Dr
- 505 E Argonne Dr
- 444 E Argonne Dr
- 440 E Argonne Dr
- 428 E Jefferson Ave
- 116 N Woodlawn Ave
- 432 E Argonne Dr
- 131 N Woodlawn Ave
- 424 E Jefferson Ave
- 418 E Argonne Dr
- 415 E Argonne Dr
- 420 E Jefferson Ave
- 126 N Woodlawn Ave
- 515 E Argonne Dr
- 414 E Argonne Dr
- 410 E Jefferson Ave
- 119 S Woodlawn Ave
- 406 E Jefferson Ave
- 411 E Argonne Dr
Your Personal Tour Guide
Ask me questions while you tour the home.