Estimated Value: $452,266 - $578,000
Studio
--
Bath
1,956
Sq Ft
$260/Sq Ft
Est. Value
About This Home
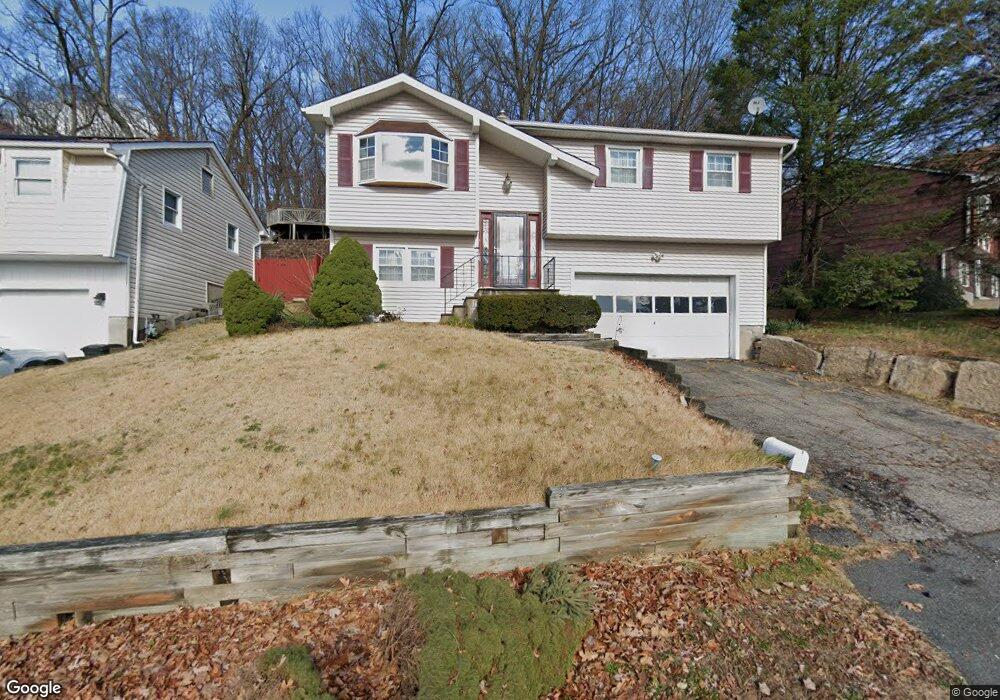
This home is located at 443 E Mcfarlan St, Dover, NJ 07801 and is currently estimated at $508,317, approximately $259 per square foot. 443 E Mcfarlan St is a home located in Morris County with nearby schools including Dover Middle School, Dover High School, and Divine Mercy Academy.
Ownership History
Date
Name
Owned For
Owner Type
Purchase Details
Closed on
Jun 4, 2013
Sold by
Luis Noriel T San and Luis Sheila San
Bought by
Luis Noriel T San
Current Estimated Value
Purchase Details
Closed on
Oct 16, 2000
Sold by
Polidor Leboeuf Madeline L and Leboeuf Lynn Anthony
Bought by
Sanluis Noriel T and Sanluis Sheila
Home Financials for this Owner
Home Financials are based on the most recent Mortgage that was taken out on this home.
Original Mortgage
$148,000
Outstanding Balance
$53,627
Interest Rate
7.83%
Mortgage Type
Stand Alone First
Estimated Equity
$454,690
Create a Home Valuation Report for This Property
The Home Valuation Report is an in-depth analysis detailing your home's value as well as a comparison with similar homes in the area
Home Values in the Area
Average Home Value in this Area
Purchase History
| Date | Buyer | Sale Price | Title Company |
|---|---|---|---|
| Luis Noriel T San | -- | None Available | |
| Sanluis Noriel T | $185,000 | -- |
Source: Public Records
Mortgage History
| Date | Status | Borrower | Loan Amount |
|---|---|---|---|
| Open | Sanluis Noriel T | $148,000 |
Source: Public Records
Tax History
| Year | Tax Paid | Tax Assessment Tax Assessment Total Assessment is a certain percentage of the fair market value that is determined by local assessors to be the total taxable value of land and additions on the property. | Land | Improvement |
|---|---|---|---|---|
| 2025 | $9,505 | $290,400 | $78,500 | $211,900 |
| 2024 | $9,168 | $290,400 | $78,500 | $211,900 |
Source: Public Records
Map
Nearby Homes
- 12 David St
- 301 E McFarlan St -A and B
- 4 W Cooper St
- 515 Herrick Dr
- 12 Lincoln Ave
- 71 Washington Ave Unit 73
- 77B Highland Way
- 67 Victory Ct Unit 67B
- 18 Elycroft Ave
- 32 Heritage Way
- 19 Heritage Way
- 93 Mount Pleasant Ave Unit F14
- 179 Pequannock St
- 318 W Main St
- 31 Independence Way
- 22 Faesch Ct
- 121 W Clinton St
- 13 James St
- 195 Mount Pleasant Ave
- 73 Laurelwood Ct Unit 73
- 439 E Mcfarlan St
- 447 E Mcfarlan St
- 435 E Mcfarlan St
- 82 Swede Mine Rd
- 8 Ekstrom St
- 454 E Mcfarlan St
- 431 E Mcfarlan St
- 14 Ekstrom St
- 456 E Mcfarlan St
- 462 E Mcfarlan St
- 436 E Mcfarlan St
- 466 E Mcfarlan St
- 10 Michael Ct
- 80 Swede Mine Rd
- 421 E Mcfarlan St
- 16 Ekstrom St
- 430 E Mcfarlan St
- 81 Swede Mine Rd
- 9 Ekstrom St
- 18 Ekstrom St
Your Personal Tour Guide
Ask me questions while you tour the home.