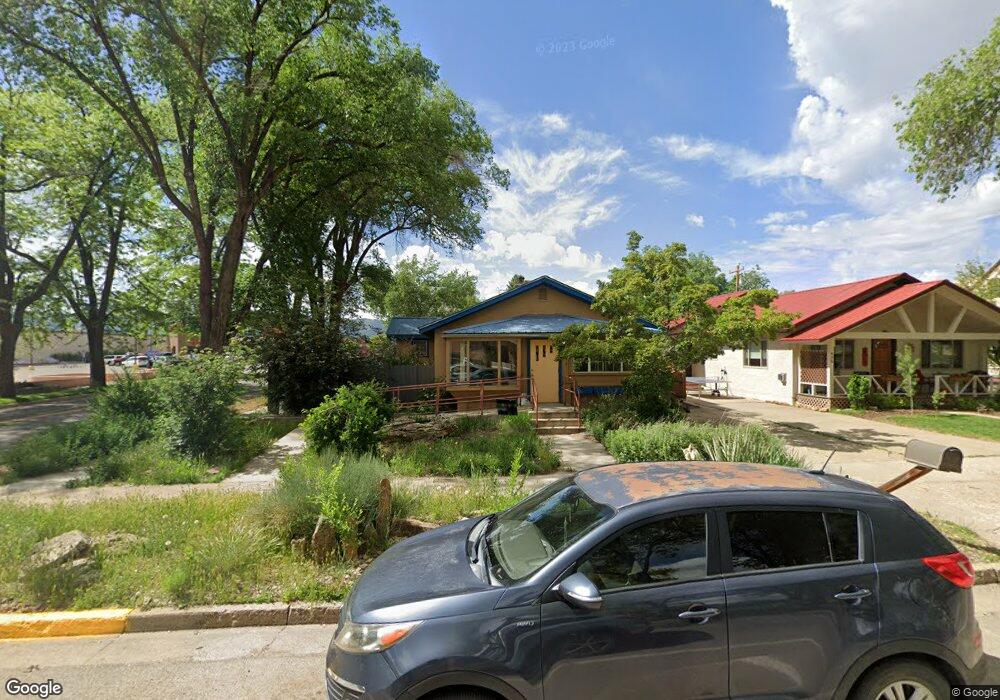
443 E Montezuma Ave Unit N. Harrison Cortez, CO 81321
Estimated Value: $267,000 - $333,000
2
Beds
2
Baths
1,164
Sq Ft
$260/Sq Ft
Est. Value
About This Home
This home is located at 443 E Montezuma Ave Unit N. Harrison, Cortez, CO 81321 and is currently estimated at $303,160, approximately $260 per square foot. 443 E Montezuma Ave Unit N. Harrison is a home located in Montezuma County with nearby schools including Montezuma-Cortez High School, Children's Kiva Montessori School, and Children's Kiva Montessori Preschool & Kindergarten.
Ownership History
Date
Name
Owned For
Owner Type
Purchase Details
Closed on
Nov 17, 2022
Sold by
Anderson Richard A
Bought by
7Th Street Llc
Current Estimated Value
Purchase Details
Closed on
Aug 22, 2016
Sold by
High Desert Health Llc
Bought by
Osterloh Randall and Osterloh Lacey
Home Financials for this Owner
Home Financials are based on the most recent Mortgage that was taken out on this home.
Original Mortgage
$144,788
Interest Rate
3.43%
Purchase Details
Closed on
Mar 22, 2006
Sold by
Schwarting Ann and Schwarting Sherry
Bought by
High Desert Health Inc
Purchase Details
Closed on
Oct 1, 2002
Sold by
Sonderleiter Joseph P and Sonderleiter Carol A
Bought by
Mccullough Schwarting Ann and Mccullough Schwarting Sherry
Create a Home Valuation Report for This Property
The Home Valuation Report is an in-depth analysis detailing your home's value as well as a comparison with similar homes in the area
Home Values in the Area
Average Home Value in this Area
Purchase History
| Date | Buyer | Sale Price | Title Company |
|---|---|---|---|
| 7Th Street Llc | -- | First American Title | |
| Osterloh Randall | -- | -- | |
| High Desert Health Inc | -- | None Available | |
| Mccullough Schwarting Ann | $96,500 | -- |
Source: Public Records
Mortgage History
| Date | Status | Borrower | Loan Amount |
|---|---|---|---|
| Previous Owner | Osterloh Randall | $144,788 | |
| Previous Owner | Osterloh Randall | -- |
Source: Public Records
Tax History Compared to Growth
Tax History
| Year | Tax Paid | Tax Assessment Tax Assessment Total Assessment is a certain percentage of the fair market value that is determined by local assessors to be the total taxable value of land and additions on the property. | Land | Improvement |
|---|---|---|---|---|
| 2024 | $894 | $17,400 | $1,977 | $15,423 |
| 2023 | $894 | $21,778 | $2,474 | $19,304 |
| 2022 | $789 | $16,313 | $1,130 | $15,183 |
| 2021 | $802 | $16,313 | $1,130 | $15,183 |
| 2020 | $655 | $13,834 | $1,243 | $12,591 |
| 2019 | $657 | $13,834 | $1,243 | $12,591 |
| 2018 | $651 | $10,220 | $1,120 | $9,100 |
| 2017 | $648 | $10,220 | $1,120 | $9,100 |
| 2016 | $560 | $9,740 | $1,240 | $8,500 |
| 2015 | $514 | $141,830 | $0 | $0 |
| 2014 | $598 | $9,740 | $0 | $0 |
Source: Public Records
Map
Nearby Homes
- 243 N Madison St
- 125 N Madison St
- 532 E Arbecam Ave
- 112 N Adams St
- 323 N Washington St
- 416 N Ash St
- 102 E Montezuma Ave
- 625 N Harrison St
- 122 E 1st St Unit see broker remarks
- 23 E Montezuma Ave
- 145 S Madison St
- 506 Amanda Lee Ln
- 201 S Washington St
- 521 N Beech St
- TBD E Empire St
- 714 E 3rd St
- 1118 E Main St
- 235 N Chestnut St Unit 6
- 306 S Ash St
- 630 E Fourth St Unit A and B
- 443 E Montezuma Ave Unit Harrison
- 443 E Montezuma Ave
- 435 E Montezuma Ave
- 115 N Harrison St
- 429 E Montezuma Ave
- TBD E Montezuma Ave
- 417 E Montezuma Ave
- 103 N Harrison St
- 106 N Madison St
- 403 E Montezuma Ave Unit 2
- 403 E Montezuma Ave Unit 1
- 444 E Montezuma Ave
- 403 E Montezuma 136 Madison
- 406 E North St
- 502 E Montezuma Ave
- 215 N Harrison St Unit and The Eagle U
- 440 E Montezuma Ave
- 438 E Montezuma Ave
- 510 E Montezuma Ave
- 136 N Madison St Unit B