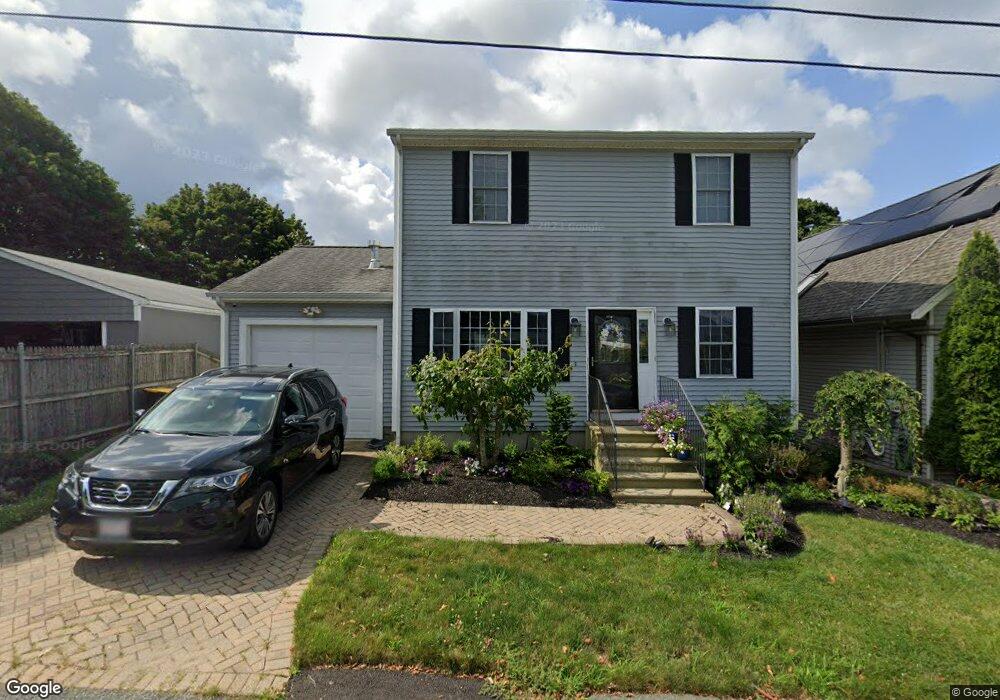
443 Ludlow St Fall River, MA 02721
Maplewood NeighborhoodEstimated Value: $412,000 - $483,000
3
Beds
2
Baths
1,566
Sq Ft
$286/Sq Ft
Est. Value
About This Home
This home is located at 443 Ludlow St, Fall River, MA 02721 and is currently estimated at $448,434, approximately $286 per square foot. 443 Ludlow St is a home located in Bristol County with nearby schools including Letourneau Elementary School, Matthew J. Kuss Middle School, and B M C Durfee High School.
Ownership History
Date
Name
Owned For
Owner Type
Purchase Details
Closed on
Jun 22, 2004
Sold by
Ponte Elizabeth and Ponte George
Bought by
Viana Joseph and Viana Rosemary P
Current Estimated Value
Create a Home Valuation Report for This Property
The Home Valuation Report is an in-depth analysis detailing your home's value as well as a comparison with similar homes in the area
Home Values in the Area
Average Home Value in this Area
Purchase History
| Date | Buyer | Sale Price | Title Company |
|---|---|---|---|
| Viana Joseph | $40,000 | -- |
Source: Public Records
Mortgage History
| Date | Status | Borrower | Loan Amount |
|---|---|---|---|
| Open | Viana Joseph | $50,000 |
Source: Public Records
Tax History Compared to Growth
Tax History
| Year | Tax Paid | Tax Assessment Tax Assessment Total Assessment is a certain percentage of the fair market value that is determined by local assessors to be the total taxable value of land and additions on the property. | Land | Improvement |
|---|---|---|---|---|
| 2025 | $4,194 | $366,300 | $114,400 | $251,900 |
| 2024 | $3,954 | $344,100 | $112,200 | $231,900 |
| 2023 | $4,061 | $331,000 | $101,100 | $229,900 |
| 2022 | $3,638 | $288,300 | $95,400 | $192,900 |
| 2021 | $3,484 | $251,900 | $91,100 | $160,800 |
| 2020 | $3,430 | $237,400 | $86,900 | $150,500 |
| 2019 | $3,434 | $235,500 | $90,900 | $144,600 |
| 2018 | $3,335 | $228,100 | $91,500 | $136,600 |
| 2017 | $3,161 | $225,800 | $91,500 | $134,300 |
| 2016 | $3,018 | $221,400 | $94,400 | $127,000 |
| 2015 | $2,791 | $213,400 | $94,400 | $119,000 |
| 2014 | $2,685 | $213,400 | $94,400 | $119,000 |
Source: Public Records
Map
Nearby Homes
- 478 Tucker St
- 125 Carl St
- 539 Aetna St
- 59 Wayne St
- 415 Anthony St
- 256 Rhode Island Ave
- 80 Lane St
- 59 Denver St
- 323 S Oxford St
- 495 Chicago St
- 1441 Stafford Rd
- 191 Glasgow St Unit 2
- 191 Glasgow St Unit 1
- 306 Mott St
- 239 Glasgow St Unit 8
- 352 Vale St Unit 1
- 340 Vale St
- 493 Peckham St
- 215 Cambridge St
- 54 Grinnell St