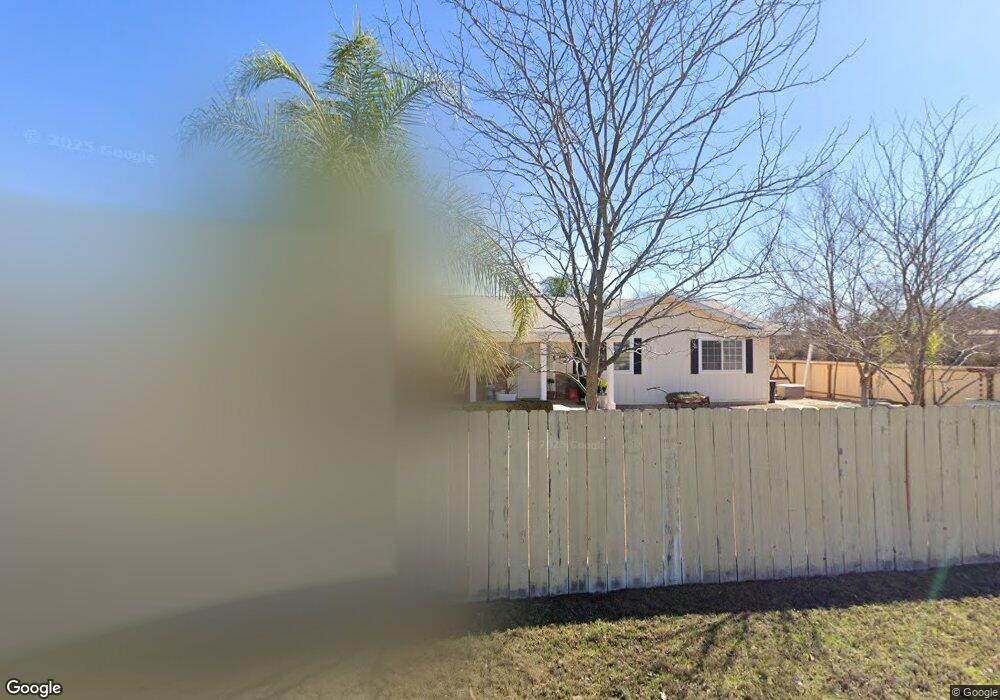
443 N Kalbaugh St Ramona, CA 92065
Estimated Value: $649,000 - $785,000
3
Beds
2
Baths
1,352
Sq Ft
$536/Sq Ft
Est. Value
About This Home
This home is located at 443 N Kalbaugh St, Ramona, CA 92065 and is currently estimated at $724,660, approximately $535 per square foot. 443 N Kalbaugh St is a home located in San Diego County with nearby schools including Hanson Elementary School, Olive Peirce Middle School, and Ramona High School.
Ownership History
Date
Name
Owned For
Owner Type
Purchase Details
Closed on
Apr 14, 1998
Sold by
Cook Donald D and Cook Mary L
Bought by
Cook Robert S
Current Estimated Value
Home Financials for this Owner
Home Financials are based on the most recent Mortgage that was taken out on this home.
Original Mortgage
$123,750
Outstanding Balance
$23,409
Interest Rate
7.06%
Estimated Equity
$701,251
Purchase Details
Closed on
Jan 3, 1997
Sold by
Garnier Tracee E
Bought by
Cook Robert S
Purchase Details
Closed on
Dec 12, 1991
Create a Home Valuation Report for This Property
The Home Valuation Report is an in-depth analysis detailing your home's value as well as a comparison with similar homes in the area
Home Values in the Area
Average Home Value in this Area
Purchase History
| Date | Buyer | Sale Price | Title Company |
|---|---|---|---|
| Cook Robert S | -- | Chicago Title Co | |
| Cook Robert S | -- | -- | |
| -- | $155,000 | -- |
Source: Public Records
Mortgage History
| Date | Status | Borrower | Loan Amount |
|---|---|---|---|
| Open | Cook Robert S | $123,750 |
Source: Public Records
Tax History Compared to Growth
Tax History
| Year | Tax Paid | Tax Assessment Tax Assessment Total Assessment is a certain percentage of the fair market value that is determined by local assessors to be the total taxable value of land and additions on the property. | Land | Improvement |
|---|---|---|---|---|
| 2025 | $2,928 | $268,033 | $83,752 | $184,281 |
| 2024 | $2,928 | $262,778 | $82,110 | $180,668 |
| 2023 | $2,678 | $257,626 | $80,500 | $177,126 |
| 2022 | $2,826 | $252,575 | $78,922 | $173,653 |
| 2021 | $2,777 | $247,624 | $77,375 | $170,249 |
| 2020 | $2,749 | $245,086 | $76,582 | $168,504 |
| 2019 | $2,683 | $240,281 | $75,081 | $165,200 |
| 2018 | $2,613 | $235,570 | $73,609 | $161,961 |
| 2017 | $650 | $230,952 | $72,166 | $158,786 |
| 2016 | $2,512 | $226,424 | $70,751 | $155,673 |
| 2015 | $2,477 | $223,024 | $69,689 | $153,335 |
| 2014 | $2,422 | $218,656 | $68,324 | $150,332 |
Source: Public Records
Map
Nearby Homes
- 0 N Kalbaugh St
- 2162 Montecito Rd
- 2235 Toub St
- 2542 Mitten Ln
- 111 Village Walk Way
- 121 Village Walk Way
- 0 Robertson St
- 1 Robertson St
- 263 Sawday St
- 1703 Main St
- 2366 Main St
- 995 Laky Ln
- 2419 Montecito Rd
- 1914 Raymond Ave
- 0 Montecito Rd Unit 1
- 526 Brazos St
- 1344 Shoshone Falls Dr
- 1334 Shoshone Falls Dr
- 0 Raymond Ave Unit NDP2406052
- 315 Hunter St
- 0 N Kalbaugh St
- 488 N Kalbaugh St
- 505 N Kalbaugh St
- 420 N Kalbaugh St Unit 24
- 510 N Kalbaugh St
- 456 N Hunter St
- 359 Hunter St
- 324 Hunter St
- 517 N Kalbaugh St
- 2102 Montecito Rd
- 504 N Hunter St
- 358 N Kalbaugh St
- 2118 Montecito Rd
- 2022 Montecito Rd
- 310 Hunter St
- 2044 Montecito Rd
- 453 N Hunter St
- 389 Letton St
- M54 Montecito Rd
- 360 Letton St