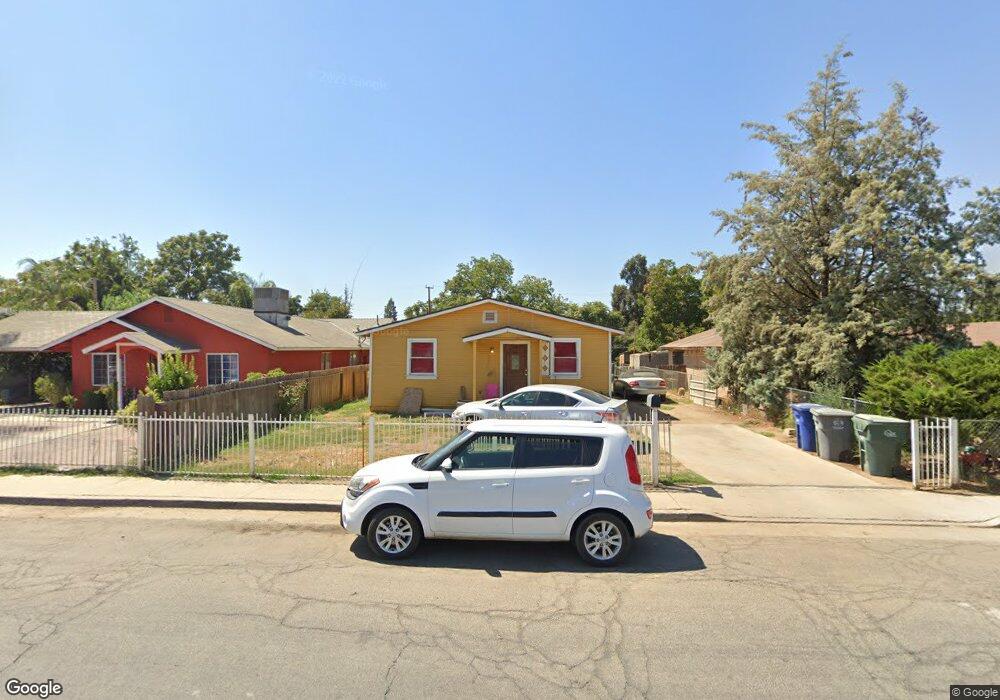
443 N Oakview Ave Farmersville, CA 93223
Estimated Value: $228,000 - $280,000
3
Beds
1
Bath
1,121
Sq Ft
$233/Sq Ft
Est. Value
About This Home
This home is located at 443 N Oakview Ave, Farmersville, CA 93223 and is currently estimated at $260,652, approximately $232 per square foot. 443 N Oakview Ave is a home located in Tulare County with nearby schools including J.E. Hester Elementary School, George L. Snowden Elementary School, and Freedom Elementary School.
Ownership History
Date
Name
Owned For
Owner Type
Purchase Details
Closed on
Jul 22, 2022
Sold by
Puga Mendoza Benjamin and Puga Maria
Bought by
Puga-Meraz Brenda Karina
Current Estimated Value
Purchase Details
Closed on
Nov 6, 2015
Sold by
Coon Sharlene
Bought by
Mendoza Benjamin Puga and Puga Maria
Home Financials for this Owner
Home Financials are based on the most recent Mortgage that was taken out on this home.
Original Mortgage
$39,000
Interest Rate
3.71%
Mortgage Type
Seller Take Back
Purchase Details
Closed on
Nov 2, 2000
Sold by
Randle William A
Bought by
Randle William A and Randle Mary Jo
Purchase Details
Closed on
Oct 20, 2000
Sold by
Smith Roberts Patricia L
Bought by
Simpson Vickie Carol
Purchase Details
Closed on
May 5, 1997
Sold by
Smith Roberts Patricia L
Bought by
Roberts Henry C
Create a Home Valuation Report for This Property
The Home Valuation Report is an in-depth analysis detailing your home's value as well as a comparison with similar homes in the area
Home Values in the Area
Average Home Value in this Area
Purchase History
| Date | Buyer | Sale Price | Title Company |
|---|---|---|---|
| Puga-Meraz Brenda Karina | -- | None Listed On Document | |
| Mendoza Benjamin Puga | $67,000 | Old Republic Title Company | |
| Coon Sharlene | -- | Old Republic Title Company | |
| Simpson Vickie Carol | -- | Old Republic Title Company | |
| Coon Sharlene | -- | Old Republic Title Company | |
| Randle William A | -- | -- | |
| Simpson Vickie Carol | -- | -- | |
| Roberts Henry C | -- | -- |
Source: Public Records
Mortgage History
| Date | Status | Borrower | Loan Amount |
|---|---|---|---|
| Previous Owner | Mendoza Benjamin Puga | $39,000 |
Source: Public Records
Tax History Compared to Growth
Tax History
| Year | Tax Paid | Tax Assessment Tax Assessment Total Assessment is a certain percentage of the fair market value that is determined by local assessors to be the total taxable value of land and additions on the property. | Land | Improvement |
|---|---|---|---|---|
| 2025 | $2,449 | $223,686 | $67,626 | $156,060 |
| 2024 | $2,449 | $219,300 | $66,300 | $153,000 |
| 2023 | $879 | $76,234 | $28,445 | $47,789 |
| 2022 | $815 | $74,740 | $27,888 | $46,852 |
| 2021 | $799 | $73,274 | $27,341 | $45,933 |
| 2020 | $787 | $72,523 | $27,061 | $45,462 |
| 2019 | $800 | $71,101 | $26,530 | $44,571 |
| 2018 | $773 | $69,707 | $26,010 | $43,697 |
| 2017 | $787 | $68,340 | $25,500 | $42,840 |
| 2016 | $571 | $51,846 | $19,942 | $31,904 |
| 2015 | $567 | $51,067 | $19,642 | $31,425 |
| 2014 | $546 | $50,066 | $19,257 | $30,809 |
Source: Public Records
Map
Nearby Homes
- 903 E Ash St
- 885 E Ash St
- 732 N Dwight Ave
- 753 N Brundage Ave
- 738 E Larry St
- 680 E Larry St
- 438 N Magnolia Ave
- 209 S Magnolia Ave
- 701 Farmersville Rd
- 896 Farmersville Rd
- 528 S Camelia Ave
- 322 E Citrus Dr
- 0 S Farmersville Blvd Unit 238390
- 327 S Farmersville Blvd
- 245 W Oakland St
- 0 Avenue 288
- 1643 Tehama Ave
- 0 Avenue 288
- 896 N Mariposa Ave
- 391 Teddy St
- 423 N Oakview Ave
- 469 N Oakview Ave
- 405 N Oakview Ave
- 456 N Oakview Ave
- 428 N Oakview Ave
- 410 N Oakview Ave
- 485 N Oakview Ave
- 381 N Oakview Ave
- 396 N Oakview Ave
- 1022 E Elm St
- 497 N Oakview Ave
- 474 N Oakview Ave
- 982 E Elm St
- 1091 E Ash St
- 376 N Oakview Ave
- 1009 E Ash St
- 1103 E Ash St
- 362 N Oakview Ave
- 1125 E Ash St
- 527 N Oakview Ave