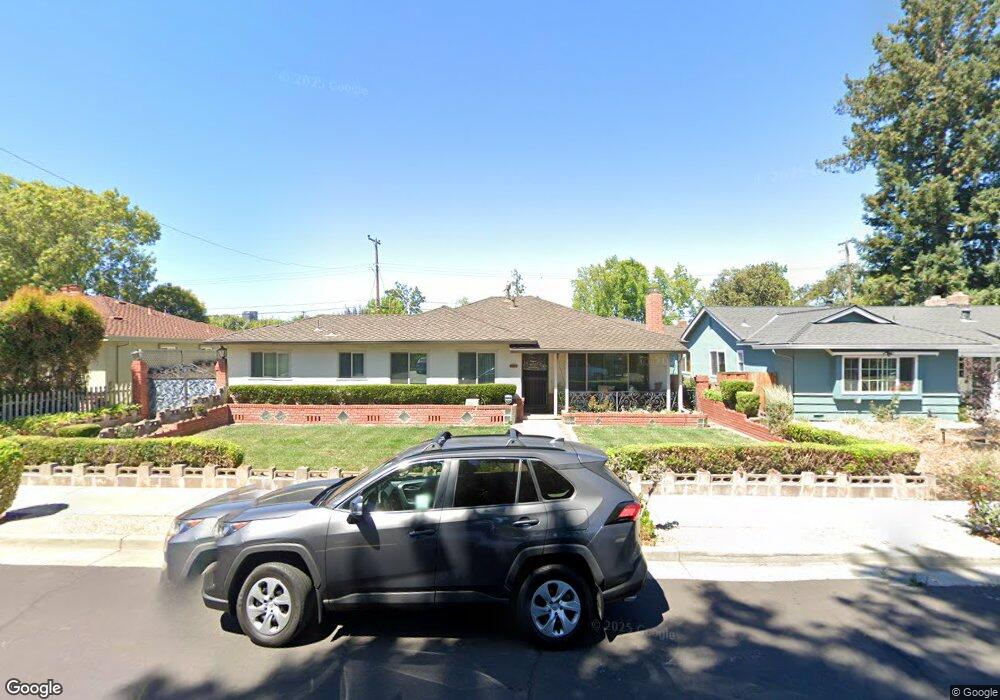
443 Nottingham Way Campbell, CA 95008
Estimated Value: $1,995,000 - $2,172,000
3
Beds
2
Baths
1,728
Sq Ft
$1,209/Sq Ft
Est. Value
About This Home
This home is located at 443 Nottingham Way, Campbell, CA 95008 and is currently estimated at $2,088,852, approximately $1,208 per square foot. 443 Nottingham Way is a home located in Santa Clara County with nearby schools including Del Mar High School, Blackford Elementary, and Sherman Oaks Elementary School.
Ownership History
Date
Name
Owned For
Owner Type
Purchase Details
Closed on
Aug 4, 2018
Sold by
Grelli Roy and Grelli Roy J
Bought by
Grelli Roy and Grelli Celia
Current Estimated Value
Home Financials for this Owner
Home Financials are based on the most recent Mortgage that was taken out on this home.
Original Mortgage
$300,000
Outstanding Balance
$260,538
Interest Rate
4.5%
Mortgage Type
New Conventional
Estimated Equity
$1,828,314
Purchase Details
Closed on
Mar 10, 2016
Sold by
Cardenas Josephine C
Bought by
Cardenas Josephine C and Josephine C Cardenas Trust
Purchase Details
Closed on
Mar 25, 2015
Sold by
Grelli Vincent S
Bought by
Vincent S Grelli & Sandra L Grelli Trust and Grelli Sandra L
Purchase Details
Closed on
Jul 13, 2010
Sold by
Cardenas Josephine C
Bought by
Cardenas Josephine C and Grelli Vincent S
Purchase Details
Closed on
Dec 19, 2001
Sold by
Grelli Rose I
Bought by
Grelli Rose I
Create a Home Valuation Report for This Property
The Home Valuation Report is an in-depth analysis detailing your home's value as well as a comparison with similar homes in the area
Home Values in the Area
Average Home Value in this Area
Purchase History
We collect this data history from publicly available records. To have your information removed, we recommend requesting removal directly through your county’s website.
| Date | Buyer | Sale Price | Title Company |
|---|---|---|---|
| Grelli Roy | -- | Servicelink | |
| Grelli Roy J | $800,000 | Servicelink | |
| Cardenas Josephine C | -- | None Available | |
| Vincent S Grelli & Sandra L Grelli Trust | -- | None Available | |
| Cardenas Josephine C | -- | None Available | |
| Grelli Rose I | -- | -- |
Source: Public Records
Mortgage History
We collect this data history from publicly available records. To have your information removed, we recommend requesting removal directly through your county’s website.
| Date | Status | Borrower | Loan Amount |
|---|---|---|---|
| Open | Grelli Roy | $300,000 |
Source: Public Records
Tax History
| Year | Tax Paid | Tax Assessment Tax Assessment Total Assessment is a certain percentage of the fair market value that is determined by local assessors to be the total taxable value of land and additions on the property. | Land | Improvement |
|---|---|---|---|---|
| 2025 | $14,111 | $1,116,410 | $937,650 | $178,760 |
| 2024 | $14,111 | $1,094,520 | $919,265 | $175,255 |
| 2023 | $13,915 | $1,073,060 | $901,241 | $171,819 |
| 2022 | $13,836 | $1,052,020 | $883,570 | $168,450 |
| 2021 | $13,585 | $1,031,394 | $866,246 | $165,148 |
| 2020 | $13,469 | $1,040,604 | $874,362 | $166,242 |
| 2019 | $14,217 | $1,097,463 | $890,548 | $206,915 |
| 2018 | $1,966 | $90,914 | $21,496 | $69,418 |
| 2017 | $1,920 | $89,132 | $21,075 | $68,057 |
| 2016 | $1,802 | $87,385 | $20,662 | $66,723 |
| 2015 | $1,745 | $86,073 | $20,352 | $65,721 |
| 2014 | $1,608 | $84,388 | $19,954 | $64,434 |
Source: Public Records
Map
Nearby Homes
- 381 Manchester Ave
- 1751 Braddock Ct
- 1482 Ridgeley Dr
- 1602 Sheffield Ave
- 1776 Braddock Ct Unit 25
- 1940 Huxley Ct Unit 399
- 68 N Midway St
- 1540 Norman Ave
- 1362 Keenan Way
- 1241 Beaulieu Ct
- 1759 Willowhurst Ave
- 1870 Patio Dr
- 1475 Norman Ave
- 912 Campisi Way Unit 311
- 912 Campisi Way Unit 417
- 912 Campisi Way Unit 402
- 1550 San Gabriel Way
- 1072 Arroyo Seco Dr
- 1844 Arroyo Seco Dr
- 1670 Cabana Dr
- 417 Nottingham Way
- 393 Nottingham Way
- 421 Nottingham Way
- 416 Manchester Ave
- 392 Manchester Ave
- 420 Manchester Ave
- 381 Nottingham Way
- 431 Nottingham Way
- 416 Nottingham Way
- 380 Manchester Ave
- 430 Manchester Ave
- 392 Nottingham Way
- 420 Nottingham Way
- 367 Nottingham Way
- 380 Nottingham Way
- 430 Nottingham Way
- 366 Manchester Ave
- 442 Manchester Ave
- 366 Nottingham Way
- 442 Nottingham Way
Your Personal Tour Guide
Ask me questions while you tour the home.