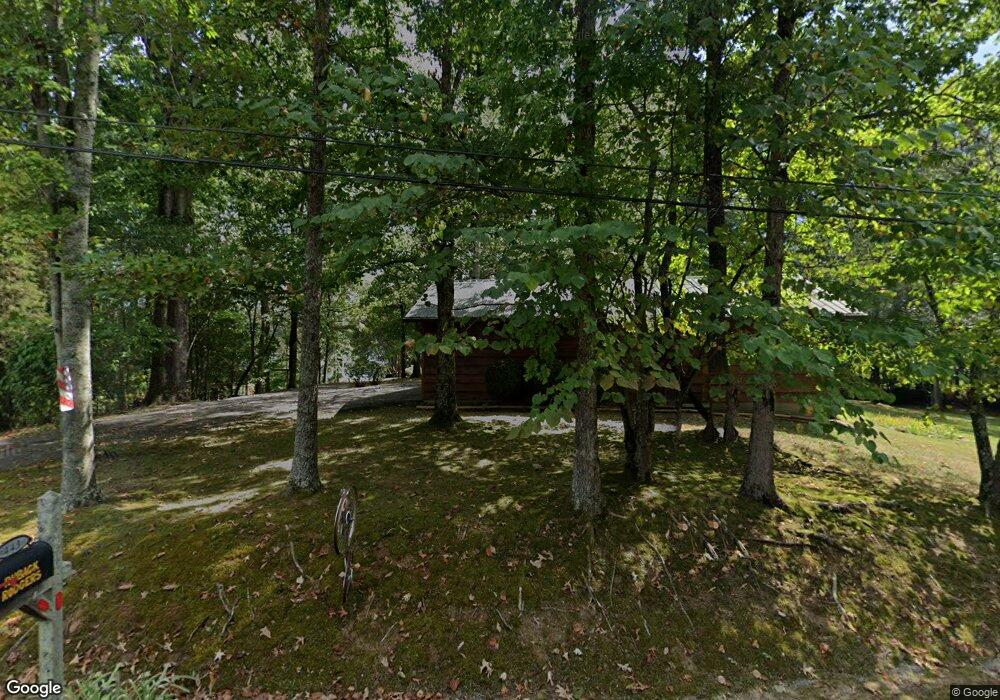
443 Piney Point Rd Spring City, TN 37381
Estimated Value: $577,000 - $618,000
4
Beds
3
Baths
1,778
Sq Ft
$335/Sq Ft
Est. Value
About This Home
This home is located at 443 Piney Point Rd, Spring City, TN 37381 and is currently estimated at $596,237, approximately $335 per square foot. 443 Piney Point Rd is a home located in Rhea County with nearby schools including Rhea County High School.
Ownership History
Date
Name
Owned For
Owner Type
Purchase Details
Closed on
Sep 27, 2005
Bought by
Rodgers Audrey I Trustee
Current Estimated Value
Purchase Details
Closed on
Apr 2, 2004
Sold by
Huff Michael O
Bought by
Bell Vance D
Purchase Details
Closed on
Aug 4, 1999
Sold by
Hill Danny L
Bought by
Huff Michael O
Purchase Details
Closed on
Feb 27, 1990
Bought by
Hill Danny L
Purchase Details
Closed on
Oct 31, 1978
Bought by
Braski David N and Braski Nancy
Create a Home Valuation Report for This Property
The Home Valuation Report is an in-depth analysis detailing your home's value as well as a comparison with similar homes in the area
Home Values in the Area
Average Home Value in this Area
Purchase History
| Date | Buyer | Sale Price | Title Company |
|---|---|---|---|
| Rodgers Audrey I Trustee | $353,000 | -- | |
| Bell Vance D | $314,000 | -- | |
| Huff Michael O | $210,000 | -- | |
| Hill Danny L | $60,000 | -- | |
| Braski David N | -- | -- |
Source: Public Records
Tax History Compared to Growth
Tax History
| Year | Tax Paid | Tax Assessment Tax Assessment Total Assessment is a certain percentage of the fair market value that is determined by local assessors to be the total taxable value of land and additions on the property. | Land | Improvement |
|---|---|---|---|---|
| 2024 | $1,765 | $130,900 | $62,500 | $68,400 |
| 2023 | $2,362 | $104,775 | $56,250 | $48,525 |
| 2022 | $2,362 | $104,775 | $56,250 | $48,525 |
| 2021 | $2,362 | $104,775 | $56,250 | $48,525 |
| 2020 | $2,362 | $104,775 | $56,250 | $48,525 |
| 2019 | $2,362 | $104,775 | $56,250 | $48,525 |
| 2018 | $2,144 | $97,625 | $56,250 | $41,375 |
| 2017 | $2,151 | $97,625 | $56,250 | $41,375 |
| 2016 | $2,151 | $97,925 | $56,250 | $41,675 |
| 2015 | $2,053 | $97,925 | $56,250 | $41,675 |
| 2014 | $2,053 | $97,925 | $56,250 | $41,675 |
| 2013 | -- | $97,925 | $56,250 | $41,675 |
Source: Public Records
Map
Nearby Homes
- 3702 Toestring Valley Rd
- 0 Lakewood Village Dr
- 0 Cypress Dr Unit 20245236
- 1060 Spruce Dr
- Lot 272 Spruce Dr
- 0 Sherwood Shores Dr Unit 1377769
- 0 Sherwood Shores Dr Unit RTC2796341
- 00 Hickory Dr
- 272 Russell Ave
- Lot 286 Maple Dr
- 0 Maple Dr Unit 1298937
- 0 Maple Dr Unit 20251864
- 0 Maple Dr Unit RTC2823363
- 0 Maple Dr Unit 1511820
- 185 Oak Tree Rd
- 00 Dogwood Ct
- Lot 215 Hickory Dr
- Lot 238 Hickory Dr
- 4.99 acres Juniper Ct
- 397 Piney Point Rd
- 505 Piney Point Rd Unit lot 1
- 505 Piney Point Rd
- 549 Piney Point Rd
- 193 Piney Point Rd
- 193 Lot 7 Piney Point Ln Unit Lot 7
- 177 Piney Bay Ln
- 193 Piney Point Ln
- 193 Piney Point Ln Unit 7
- 163 Piney Bay Ln
- 430 Piney Point Rd
- 0 Piney Point Ln Unit 1255814
- 0 Piney Point Ln
- 204 Piney Bay Ln
- 350 Piney Point Rd
- 194 Piney Bay Ln
- 146 Piney Bay Ln Unit 14
- 146 Piney Bay Ln
- 162 Piney Bay Ln
- 162 Piney Bay Ln Unit 13