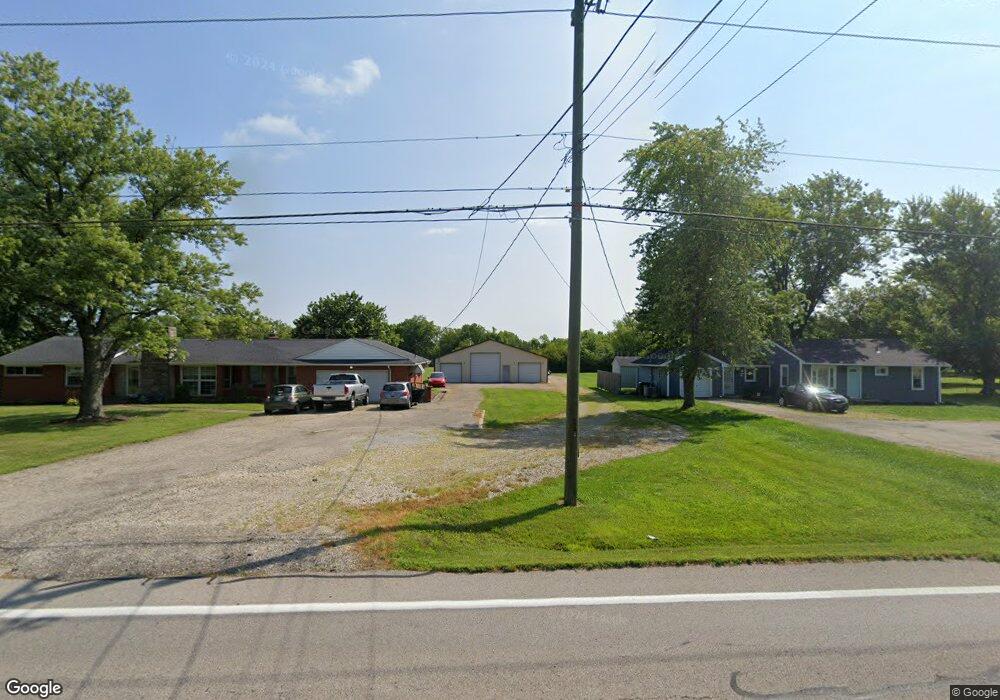
4430 State Route 123 Franklin, OH 45005
Estimated Value: $321,090 - $334,000
3
Beds
2
Baths
1,512
Sq Ft
$218/Sq Ft
Est. Value
About This Home
This home is located at 4430 State Route 123, Franklin, OH 45005 and is currently estimated at $329,273, approximately $217 per square foot. 4430 State Route 123 is a home located in Warren County with nearby schools including Clearcreek Elementary School, Dennis Elementary School, and Springboro Intermediate School.
Ownership History
Date
Name
Owned For
Owner Type
Purchase Details
Closed on
Jan 30, 2018
Sold by
Renner Diana J
Bought by
Johnson Michael D
Current Estimated Value
Home Financials for this Owner
Home Financials are based on the most recent Mortgage that was taken out on this home.
Original Mortgage
$156,750
Outstanding Balance
$132,619
Interest Rate
3.95%
Mortgage Type
New Conventional
Estimated Equity
$196,654
Purchase Details
Closed on
Jan 31, 2017
Sold by
Renner James W
Bought by
Renner Diana J and Renner R
Purchase Details
Closed on
Jun 1, 1994
Sold by
Franlin Sidney A
Bought by
Renner James W and Renner Diana J
Home Financials for this Owner
Home Financials are based on the most recent Mortgage that was taken out on this home.
Original Mortgage
$30,000
Interest Rate
8.48%
Mortgage Type
New Conventional
Create a Home Valuation Report for This Property
The Home Valuation Report is an in-depth analysis detailing your home's value as well as a comparison with similar homes in the area
Home Values in the Area
Average Home Value in this Area
Purchase History
| Date | Buyer | Sale Price | Title Company |
|---|---|---|---|
| Johnson Michael D | $173,000 | -- | |
| Renner Diana J | -- | -- | |
| Renner James W | $121,000 | -- |
Source: Public Records
Mortgage History
| Date | Status | Borrower | Loan Amount |
|---|---|---|---|
| Open | Johnson Michael D | $156,750 | |
| Previous Owner | Renner James W | $30,000 |
Source: Public Records
Tax History Compared to Growth
Tax History
| Year | Tax Paid | Tax Assessment Tax Assessment Total Assessment is a certain percentage of the fair market value that is determined by local assessors to be the total taxable value of land and additions on the property. | Land | Improvement |
|---|---|---|---|---|
| 2024 | $3,321 | $91,130 | $27,900 | $63,230 |
| 2023 | $2,849 | $72,212 | $16,194 | $56,017 |
| 2022 | $2,797 | $72,212 | $16,195 | $56,018 |
| 2021 | $2,585 | $72,212 | $16,195 | $56,018 |
| 2020 | $2,402 | $58,709 | $13,167 | $45,542 |
| 2019 | $2,416 | $58,709 | $13,167 | $45,542 |
| 2018 | $2,049 | $58,709 | $13,167 | $45,542 |
| 2017 | $2,135 | $55,405 | $11,855 | $43,551 |
| 2016 | $2,226 | $55,405 | $11,855 | $43,551 |
| 2015 | $2,231 | $55,405 | $11,855 | $43,551 |
| 2014 | $2,086 | $50,130 | $10,900 | $39,240 |
| 2013 | $2,075 | $60,190 | $12,720 | $47,470 |
Source: Public Records
Map
Nearby Homes
- 4480 N St Rt 123
- 3136 W Pekin Rd
- 4271 Ohio 123
- 3441 Madison Grace Way
- 3457 Madison Grace Way
- 3749 Wilson Farms Blvd
- 3621 Garrett Dr
- 2958 St Rt 122
- 2958 State Route 122
- 0 Ohio 122
- 3085 Ohio 122
- 5059 Robinson Vail Rd
- 3600 Yellow Finch Way
- 3644 Connie Dr
- Chattanooga Plan at Trails of Greycliff
- Somerset Plan at Trails of Greycliff
- Miramar Plan at Trails of Greycliff
- Carlisle Plan at Trails of Greycliff
- Birmingham Plan at Trails of Greycliff
- Rockford Plan at Trails of Greycliff
- 4480 State Route 123
- 4480 Ohio 123
- 4430 Ohio 123
- 4456 Ohio 123
- 4456 State Route 123
- 4372 State Route 123
- 4387 State Route 123
- 3283 W Pekin Rd
- 3283 Pekin Rd
- 4413 State Route 123
- 4519 Ohio 123
- 4477 State Route 123
- 4286 State Route 123
- 3236 W Pekin Rd
- 4356 State Route 123
- 3209 Pekin Rd
- 4501 State Route 123
- 4501 Ohio 123
- 3181 Pekin Rd
- 4339 State Route 123