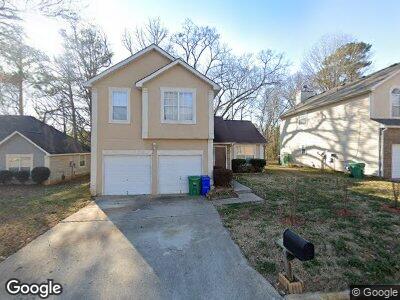
4432 Idlewood Park Lithonia, GA 30038
Lithonia NeighborhoodEstimated Value: $248,000 - $255,000
3
Beds
3
Baths
1,684
Sq Ft
$149/Sq Ft
Est. Value
About This Home
This home is located at 4432 Idlewood Park, Lithonia, GA 30038 and is currently estimated at $250,596, approximately $148 per square foot. 4432 Idlewood Park is a home located in DeKalb County with nearby schools including Flat Rock Elementary School, Salem Middle School, and Martin Luther King- Jr. High School.
Ownership History
Date
Name
Owned For
Owner Type
Purchase Details
Closed on
Jan 22, 2010
Sold by
Hud-Housing Of Urban Dev
Bought by
Thomas Twila L
Current Estimated Value
Home Financials for this Owner
Home Financials are based on the most recent Mortgage that was taken out on this home.
Original Mortgage
$59,727
Interest Rate
5.75%
Mortgage Type
FHA
Purchase Details
Closed on
Jun 9, 2009
Sold by
Midfirst Bank
Bought by
Hud-Housing Of Urban Dev
Purchase Details
Closed on
Jun 1, 2009
Sold by
Fails Pamela
Bought by
Midfirst Bk
Purchase Details
Closed on
Apr 5, 2002
Sold by
Ne Community Residential Inc
Bought by
Fails Pamela
Home Financials for this Owner
Home Financials are based on the most recent Mortgage that was taken out on this home.
Original Mortgage
$131,500
Interest Rate
6.8%
Mortgage Type
FHA
Create a Home Valuation Report for This Property
The Home Valuation Report is an in-depth analysis detailing your home's value as well as a comparison with similar homes in the area
Home Values in the Area
Average Home Value in this Area
Purchase History
| Date | Buyer | Sale Price | Title Company |
|---|---|---|---|
| Thomas Twila L | -- | -- | |
| Hud-Housing Of Urban Dev | -- | -- | |
| Midfirst Bk | $131,500 | -- | |
| Fails Pamela | $132,700 | -- |
Source: Public Records
Mortgage History
| Date | Status | Borrower | Loan Amount |
|---|---|---|---|
| Open | Thomas Twila L | $133,994 | |
| Closed | Thomas Twila L | $120,900 | |
| Closed | Thomas Twila L | $114,977 | |
| Closed | Thomas Twila L | $100,900 | |
| Closed | Thomas Twila L | $90,557 | |
| Closed | Thomas Twila L | $78,423 | |
| Closed | Thomas Twila L | $65,247 | |
| Closed | Thomas Twila L | $59,727 | |
| Previous Owner | Fails Pamela | $131,500 |
Source: Public Records
Tax History Compared to Growth
Tax History
| Year | Tax Paid | Tax Assessment Tax Assessment Total Assessment is a certain percentage of the fair market value that is determined by local assessors to be the total taxable value of land and additions on the property. | Land | Improvement |
|---|---|---|---|---|
| 2023 | $660 | $101,600 | $18,000 | $83,600 |
| 2022 | $541 | $80,120 | $9,960 | $70,160 |
| 2021 | $553 | $66,480 | $9,960 | $56,520 |
| 2020 | $546 | $60,600 | $9,960 | $50,640 |
| 2019 | $553 | $49,040 | $9,960 | $39,080 |
| 2018 | $1,141 | $41,800 | $9,960 | $31,840 |
| 2017 | $576 | $38,240 | $5,200 | $33,040 |
| 2016 | $1,794 | $32,720 | $3,880 | $28,840 |
| 2014 | $1,338 | $21,840 | $3,840 | $18,000 |
Source: Public Records
Map
Nearby Homes
- 4408 Idlewood Park
- 6023 Kingston Wood Way
- 4578 Carriage Park Dr
- 6378 Browns Mill Rd
- 4585 Post Ridge Ln
- 6205 Leverett Dr
- 6092 Leverett Dr
- 6084 Leverett Dr
- 6334 Forester Way
- 5458 Browns Mill Rd
- 7314 Browns Mill Rd
- 6776 Gina Agha Cir Unit 2
- 6531 Gina Agha Cir
- 6090 Ancestors Dr
- 6080 Ancestors Dr
- 6060 Ancestors Dr
- 6050 Ancestors Dr
- 5980 Ancestors Dr
- 5960 Ancestors Dr
- 5940 Ancestors Dr
- 4432 Idlewood Park
- 4436 Idlewood Park
- 4428 Idlewood Park
- 4524 Carriage Park Dr
- 4520 Carriage Park Dr
- 4440 Idlewood Park
- 4424 Idlewood Park
- 4530 Carriage Park Dr
- 4514 Carriage Park Dr
- 4433 Idlewood Park
- 0 Carriage Park Dr Unit 8616277
- 0 Carriage Park Dr Unit 8524186
- 0 Carriage Park Dr Unit 8520150
- 0 Carriage Park Dr Unit 8364751
- 0 Carriage Park Dr Unit 8116816
- 0 Carriage Park Dr Unit 7544940
- 0 Carriage Park Dr Unit 7314165
- 0 Carriage Park Dr Unit 3233365
- 0 Carriage Park Dr Unit 8381850
- 0 Carriage Park Dr Unit 8258094