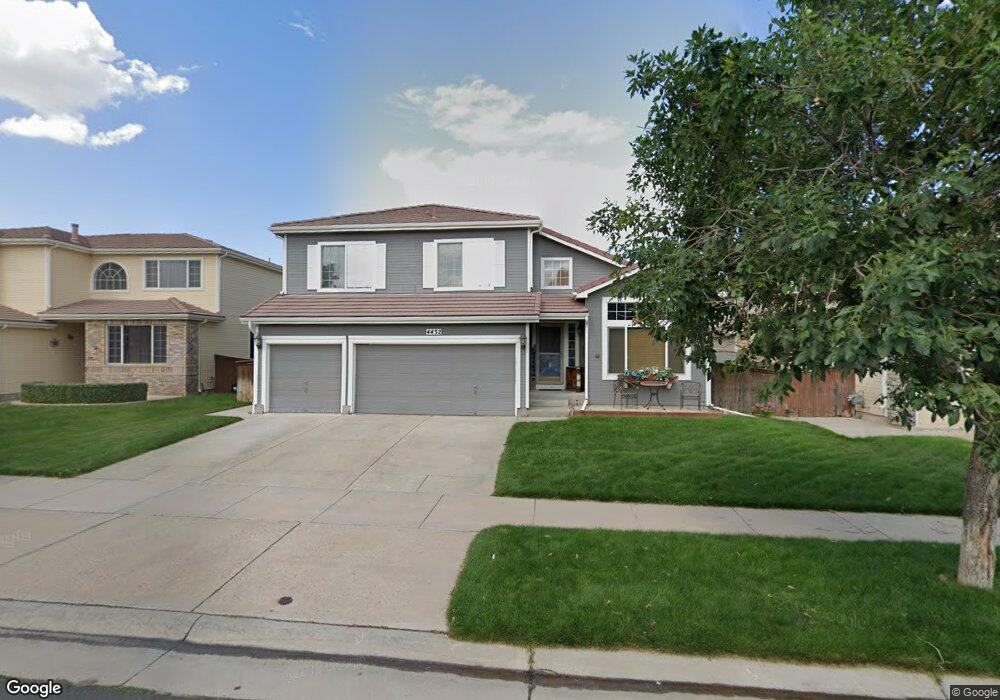
4432 Iran St Denver, CO 80249
Green Valley Ranch NeighborhoodEstimated Value: $584,708 - $661,000
4
Beds
3
Baths
4,129
Sq Ft
$150/Sq Ft
Est. Value
About This Home
This home is located at 4432 Iran St, Denver, CO 80249 and is currently estimated at $617,427, approximately $149 per square foot. 4432 Iran St is a home located in Denver County with nearby schools including Green Valley Elementary School, Pitt-Waller K-8 School, and McGlone Academy.
Ownership History
Date
Name
Owned For
Owner Type
Purchase Details
Closed on
Feb 12, 2016
Sold by
Macdonald Jesse
Bought by
Cleven Kyle and Cleven Erika
Current Estimated Value
Home Financials for this Owner
Home Financials are based on the most recent Mortgage that was taken out on this home.
Original Mortgage
$328,500
Outstanding Balance
$259,942
Interest Rate
4.05%
Mortgage Type
New Conventional
Estimated Equity
$357,485
Purchase Details
Closed on
May 26, 2006
Sold by
Lang Deborah J
Bought by
Macdonald Jesse
Home Financials for this Owner
Home Financials are based on the most recent Mortgage that was taken out on this home.
Original Mortgage
$70,000
Interest Rate
6.56%
Mortgage Type
Fannie Mae Freddie Mac
Purchase Details
Closed on
Aug 31, 1999
Sold by
Oakwood Homes Llc
Bought by
Lang Deborah J
Home Financials for this Owner
Home Financials are based on the most recent Mortgage that was taken out on this home.
Original Mortgage
$155,000
Interest Rate
7.12%
Create a Home Valuation Report for This Property
The Home Valuation Report is an in-depth analysis detailing your home's value as well as a comparison with similar homes in the area
Home Values in the Area
Average Home Value in this Area
Purchase History
| Date | Buyer | Sale Price | Title Company |
|---|---|---|---|
| Cleven Kyle | $365,000 | Land Title Guarantee | |
| Macdonald Jesse | $320,000 | Guardian Title Agency Llc | |
| Lang Deborah J | $213,390 | Land Title |
Source: Public Records
Mortgage History
| Date | Status | Borrower | Loan Amount |
|---|---|---|---|
| Open | Cleven Kyle | $328,500 | |
| Previous Owner | Macdonald Jesse | $70,000 | |
| Previous Owner | Lang Deborah J | $155,000 |
Source: Public Records
Tax History
| Year | Tax Paid | Tax Assessment Tax Assessment Total Assessment is a certain percentage of the fair market value that is determined by local assessors to be the total taxable value of land and additions on the property. | Land | Improvement |
|---|---|---|---|---|
| 2025 | $3,671 | $42,750 | $6,580 | $6,580 |
| 2024 | $3,671 | $38,930 | $2,570 | $36,360 |
| 2023 | $3,484 | $38,930 | $2,570 | $36,360 |
| 2022 | $3,132 | $31,440 | $5,190 | $26,250 |
| 2021 | $3,064 | $32,350 | $5,340 | $27,010 |
| 2020 | $2,919 | $30,960 | $4,450 | $26,510 |
| 2019 | $2,855 | $30,960 | $4,450 | $26,510 |
| 2018 | $2,622 | $26,900 | $3,590 | $23,310 |
| 2017 | $2,615 | $26,900 | $3,590 | $23,310 |
| 2016 | $2,324 | $22,860 | $3,471 | $19,389 |
| 2015 | $2,245 | $22,860 | $3,471 | $19,389 |
| 2014 | $1,744 | $16,910 | $2,388 | $14,522 |
Source: Public Records
Map
Nearby Homes
- 20762 E 44th Ave
- 20420 Kelly Place
- 4201 Ireland St
- 20423 E 43rd Ave
- 4531 Gibraltar St
- 4295 Genoa St
- 20000 E Mitchell Place Unit 71
- 4632 Gibraltar St
- 4312 Kirk Ct
- 20644 E 47th Ave
- 19037 E 64th Ave
- 20372 E 40th Place
- 20053 E 40th Ave
- 20865 E 47th Ave
- 20655 E 49th Ave
- 4839 Liverpool St
- 3841 N Himalaya Rd Unit 1
- 3880 N Jebel St
- 19609 E 47th Dr
- 20604 E 38th Place
- 4422 Iran St
- 4442 Iran St
- 4412 Iran St
- 4450 Iran St
- 4435 Iran St
- 4445 Iran St
- 4425 Iran St
- 4402 Iran St
- 20743 E Mitchell Place
- 4454 Iran St
- 4405 Iran St
- 20174 Mitchell Place
- 20175 Mitchell Place
- 4460 Iran St
- 20141 E 43rd Place
- 20154 Mitchell Place
- 20121 E 43rd Place
- 20155 Mitchell Place
- 20181 E 43rd Place
- 20161 E 43rd Place
Your Personal Tour Guide
Ask me questions while you tour the home.