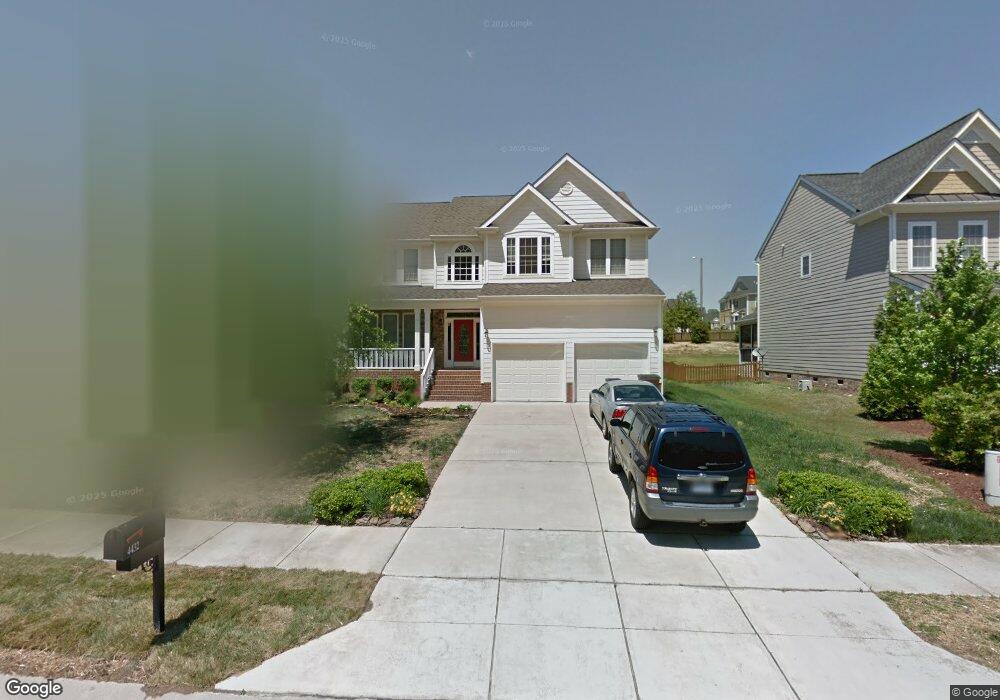
4432 Overglen Ave Wake Forest, NC 27587
Estimated Value: $465,000 - $505,000
5
Beds
4
Baths
2,600
Sq Ft
$188/Sq Ft
Est. Value
About This Home
This home is located at 4432 Overglen Ave, Wake Forest, NC 27587 and is currently estimated at $489,688, approximately $188 per square foot. 4432 Overglen Ave is a home located in Wake County with nearby schools including Sanford Creek Elementary School, Wake Forest-Rolesville Middle School, and Wake Forest High School.
Ownership History
Date
Name
Owned For
Owner Type
Purchase Details
Closed on
Apr 26, 2011
Sold by
National Residential Nominee Services In
Bought by
Estes Tricia C and Estes Marlon
Current Estimated Value
Home Financials for this Owner
Home Financials are based on the most recent Mortgage that was taken out on this home.
Original Mortgage
$208,087
Outstanding Balance
$133,280
Interest Rate
3.25%
Mortgage Type
FHA
Estimated Equity
$356,408
Purchase Details
Closed on
Sep 28, 2010
Sold by
Keskar Amol A and Keskar Nisha A
Bought by
National Residential Nominee Services In
Purchase Details
Closed on
Feb 28, 2005
Sold by
Murdock & Gannon Construction Inc
Bought by
Keskar Amol A and Keskar Nisha A
Home Financials for this Owner
Home Financials are based on the most recent Mortgage that was taken out on this home.
Original Mortgage
$208,800
Interest Rate
5%
Mortgage Type
Fannie Mae Freddie Mac
Create a Home Valuation Report for This Property
The Home Valuation Report is an in-depth analysis detailing your home's value as well as a comparison with similar homes in the area
Home Values in the Area
Average Home Value in this Area
Purchase History
| Date | Buyer | Sale Price | Title Company |
|---|---|---|---|
| Estes Tricia C | $213,500 | None Available | |
| National Residential Nominee Services In | $242,500 | None Available | |
| Keskar Amol A | $261,000 | -- |
Source: Public Records
Mortgage History
| Date | Status | Borrower | Loan Amount |
|---|---|---|---|
| Open | Estes Tricia C | $208,087 | |
| Previous Owner | Keskar Amol A | $208,800 |
Source: Public Records
Tax History
| Year | Tax Paid | Tax Assessment Tax Assessment Total Assessment is a certain percentage of the fair market value that is determined by local assessors to be the total taxable value of land and additions on the property. | Land | Improvement |
|---|---|---|---|---|
| 2025 | $4,509 | $466,151 | $84,000 | $382,151 |
| 2024 | $4,493 | $466,151 | $84,000 | $382,151 |
Source: Public Records
Map
Nearby Homes
- 4438 Hillsgrove Rd
- 4208 Tain Burgh Ct
- 4205 Ginger Sprout Dr
- 4447 Middletown Dr
- 4509 Middletown Dr
- 8330 Bratt Ave
- 2928 Thurman Dairy Loop
- 2908 Thurman Dairy Loop
- 3100 Lariat Ridge Dr
- 3100 Countryman Ct
- 8911 Elizabeth Bennet Place
- 3037 Thurman Dairy Loop
- 3065 Thurman Dairy Loop
- 3101 Greenville Loop Rd
- 3047 Winding Waters Way
- 8857 Thornton Town Place
- 3123 Winding Waters Way
- 10822 Greater Hills St
- 8840 Thornton Town Place
- 8708 Wild Wood Forest Dr
- 4428 Overglen Ave
- 4436 Overglen Ave
- 4424 Overglen Ave
- 9741 Rainsong St
- 9732 Rainsong Dr
- 4404 Iyar Way
- 4402 Iyar Way
- 9732 Rainsong St
- 4420 Overglen Ave
- 4400 Iyar Way
- 9729 Corktree Ct
- 4406 Iyar Way
- 4408 Iyar Way
- 4410 Iyar Way
- 9737 Rainsong Dr
- 9731 Corktree Ct
- 4412 Iyar Way
- 9741 Rainsong Dr
- 9728 Rainsong Dr
- 4414 Iyar Way
Your Personal Tour Guide
Ask me questions while you tour the home.