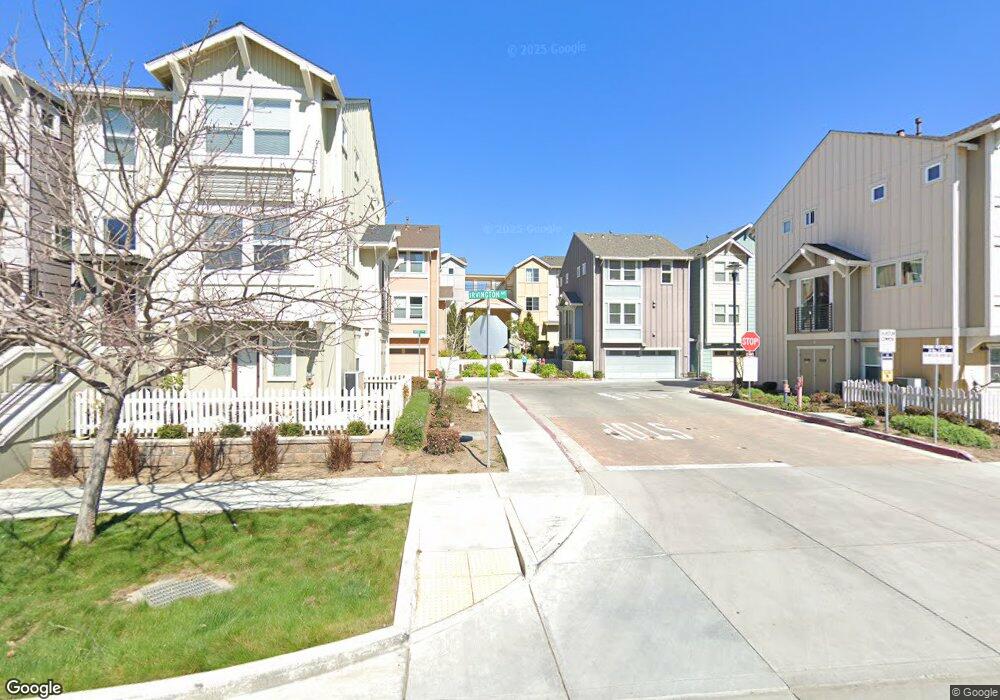
4433 Hyde Common Fremont, CA 94538
Irvington NeighborhoodEstimated Value: $1,344,000 - $1,658,796
4
Beds
4
Baths
1,738
Sq Ft
$853/Sq Ft
Est. Value
About This Home
This home is located at 4433 Hyde Common, Fremont, CA 94538 and is currently estimated at $1,483,199, approximately $853 per square foot. 4433 Hyde Common is a home located in Alameda County with nearby schools including O. N. Hirsch Elementary School, John M. Horner Junior High School, and Irvington High School.
Ownership History
Date
Name
Owned For
Owner Type
Purchase Details
Closed on
Oct 26, 2011
Sold by
Balivada Anil
Bought by
Balivada Anil and Balivada Madhavi
Current Estimated Value
Home Financials for this Owner
Home Financials are based on the most recent Mortgage that was taken out on this home.
Original Mortgage
$421,170
Outstanding Balance
$42,570
Interest Rate
4.01%
Mortgage Type
FHA
Estimated Equity
$1,440,629
Purchase Details
Closed on
Mar 26, 2010
Sold by
Balivada Madhavi
Bought by
Balivada Anil
Home Financials for this Owner
Home Financials are based on the most recent Mortgage that was taken out on this home.
Original Mortgage
$567,765
Interest Rate
5.01%
Mortgage Type
FHA
Purchase Details
Closed on
Feb 18, 2010
Sold by
Tri City Gardens Ii Llc
Bought by
Balivada Anil
Home Financials for this Owner
Home Financials are based on the most recent Mortgage that was taken out on this home.
Original Mortgage
$567,765
Interest Rate
5.01%
Mortgage Type
FHA
Create a Home Valuation Report for This Property
The Home Valuation Report is an in-depth analysis detailing your home's value as well as a comparison with similar homes in the area
Home Values in the Area
Average Home Value in this Area
Purchase History
| Date | Buyer | Sale Price | Title Company |
|---|---|---|---|
| Balivada Anil | -- | Entitle Direct Insurance | |
| Balivada Anil | -- | First American Title Company | |
| Balivada Anil | -- | First American Title Company |
Source: Public Records
Mortgage History
| Date | Status | Borrower | Loan Amount |
|---|---|---|---|
| Open | Balivada Anil | $421,170 | |
| Closed | Balivada Anil | $567,765 | |
| Closed | Balivada Anil | $567,765 |
Source: Public Records
Tax History
| Year | Tax Paid | Tax Assessment Tax Assessment Total Assessment is a certain percentage of the fair market value that is determined by local assessors to be the total taxable value of land and additions on the property. | Land | Improvement |
|---|---|---|---|---|
| 2025 | $9,714 | $800,251 | $240,075 | $560,176 |
| 2024 | $9,714 | $784,565 | $235,369 | $549,196 |
| 2023 | $9,454 | $769,184 | $230,755 | $538,429 |
| 2022 | $9,331 | $754,105 | $226,231 | $527,874 |
| 2021 | $9,103 | $739,324 | $221,797 | $517,527 |
| 2020 | $9,124 | $731,748 | $219,524 | $512,224 |
| 2019 | $9,021 | $717,401 | $215,220 | $502,181 |
| 2018 | $8,846 | $703,340 | $211,002 | $492,338 |
| 2017 | $8,626 | $689,551 | $206,865 | $482,686 |
| 2016 | $8,479 | $676,034 | $202,810 | $473,224 |
| 2015 | $8,367 | $665,885 | $199,765 | $466,120 |
| 2014 | $8,224 | $652,847 | $195,854 | $456,993 |
Source: Public Records
Map
Nearby Homes
- 4463 Hyde Common Unit 302
- 4463 Hyde Common Unit 116
- 4310 Providence Terrace
- 4612 Drury Ct
- 4637 Stratford Ave
- 40732 Fremont Blvd
- 40431 Blanchard St
- 4478 English Rose Common
- 4560 Piper St
- 3814 Clough Ave
- 40775 Max Dr
- 41212 Fremont Blvd
- 40857 Lincoln St Unit 3701
- 3918 Fossano Common
- 4753 Bach Ct
- 3861 Cosmic Place
- 3800 Adams Ave
- 4533 Capewood Terrace
- 4537 Capewood Terrace
- 4859 Hilo St
- 4427 Hyde Common
- 4420 Hyde Common
- 4426 Hyde Common
- 4421 Hyde Common Unit 79
- 4421 Hyde Common
- 4448 Hyde Common
- 4442 Hyde Common
- 4454 Hyde Common
- 4415 Hyde Common
- 4436 Hyde Common
- 4437 Irvington Ave
- 4414 Hyde Common
- 4408 Hyde Common
- 40966 Fairmont Terrace
- 40974 Fairmont Terrace
- 40982 Fairmont Terrace
- 4402 Hyde Common
- 40958 Fairmont Terrace
- 4443 Irvington Ave
- 4403 Hyde Common Unit 82
Your Personal Tour Guide
Ask me questions while you tour the home.