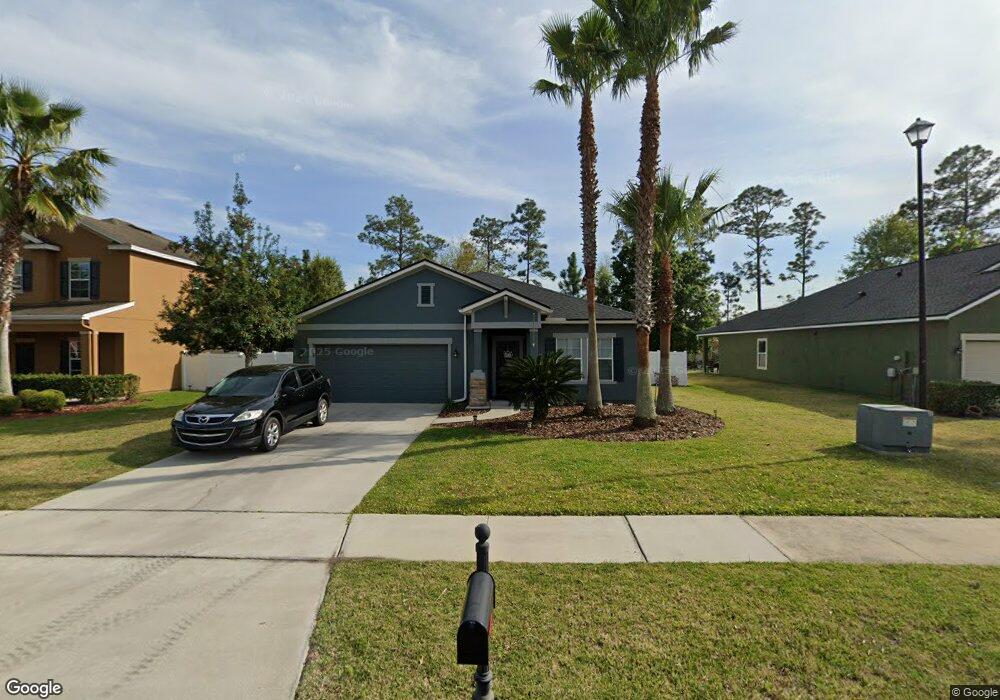
4433 Song Sparrow Dr Unit 184 Middleburg, FL 32068
Estimated Value: $342,122 - $414,000
4
Beds
2
Baths
2,046
Sq Ft
$185/Sq Ft
Est. Value
About This Home
This home is located at 4433 Song Sparrow Dr Unit 184, Middleburg, FL 32068 and is currently estimated at $379,531, approximately $185 per square foot. 4433 Song Sparrow Dr Unit 184 is a home located in Clay County with nearby schools including Tynes Elementary School, Ridgeview High School, and Wilkinson Junior High School.
Ownership History
Date
Name
Owned For
Owner Type
Purchase Details
Closed on
Jun 5, 2024
Sold by
Sfr Jv 2 Ntl Borrower Llc
Bought by
Sfr Jv-2 2024-2 Borrower Llc
Current Estimated Value
Purchase Details
Closed on
Feb 14, 2022
Sold by
Zillow Homes Property Trust
Bought by
Sfr Jv-2 Property Llc
Purchase Details
Closed on
Nov 22, 2021
Sold by
Stout Rebecca and Stout Michael A
Bought by
Zilllow Homes Property Trust
Purchase Details
Closed on
Mar 14, 2011
Sold by
Lennar Homes Llc
Bought by
Stout Rebecca
Home Financials for this Owner
Home Financials are based on the most recent Mortgage that was taken out on this home.
Original Mortgage
$146,096
Interest Rate
4.25%
Mortgage Type
FHA
Purchase Details
Closed on
Feb 4, 2010
Sold by
Two Creeks Investments Llc
Bought by
Lennar Homes Llc
Create a Home Valuation Report for This Property
The Home Valuation Report is an in-depth analysis detailing your home's value as well as a comparison with similar homes in the area
Home Values in the Area
Average Home Value in this Area
Purchase History
| Date | Buyer | Sale Price | Title Company |
|---|---|---|---|
| Sfr Jv-2 2024-2 Borrower Llc | $100 | None Listed On Document | |
| Sfr Jv-2 Property Llc | $342,000 | Matthew G Lerner Pa | |
| Zilllow Homes Property Trust | $337,647 | Stewart Title | |
| Stout Rebecca | $149,900 | North American Title Company | |
| Lennar Homes Llc | $185,000 | Attorney |
Source: Public Records
Mortgage History
| Date | Status | Borrower | Loan Amount |
|---|---|---|---|
| Previous Owner | Stout Rebecca | $146,096 |
Source: Public Records
Tax History Compared to Growth
Tax History
| Year | Tax Paid | Tax Assessment Tax Assessment Total Assessment is a certain percentage of the fair market value that is determined by local assessors to be the total taxable value of land and additions on the property. | Land | Improvement |
|---|---|---|---|---|
| 2024 | $7,552 | $299,306 | $60,000 | $239,306 |
| 2023 | $7,552 | $304,446 | $60,000 | $244,446 |
| 2022 | $6,868 | $273,607 | $45,000 | $228,607 |
| 2021 | $4,536 | $156,983 | $0 | $0 |
| 2020 | $4,469 | $154,816 | $0 | $0 |
| 2019 | $4,369 | $151,336 | $0 | $0 |
| 2018 | $4,119 | $148,514 | $0 | $0 |
| 2017 | $4,040 | $145,459 | $0 | $0 |
| 2016 | $4,035 | $142,467 | $0 | $0 |
| 2015 | $4,084 | $141,477 | $0 | $0 |
| 2014 | $3,974 | $140,354 | $0 | $0 |
Source: Public Records
Map
Nearby Homes
- 4409 Song Sparrow Dr
- 1467 King Rail Ln
- 4467 Song Sparrow Dr
- 4634 Pine Ridge Pkwy
- 4015 Cormorant Ln
- 4008 Cormorant Ln
- 1087 Persimmon Dr
- 4556 Pine Ridge Pkwy
- 4522 Oak Moss Loop
- 1124 Persimmon Dr
- 3954 Trail Ridge Rd
- 1306 Warbler Way
- 4023 Trail Ridge Rd
- 4045 Trail Ridge Rd
- 1766 Foggy Day Dr
- 4053 Trail Ridge Rd
- 7220 Cottonwood Ct
- 1223 Hatcher Rd
- 4296 Great Egret Way
- 4255 Sandhill Crane Terrace
- 4433 Song Sparrow Dr
- 4429 Song Sparrow Dr Unit 183
- 4429 Song Sparrow Dr
- 4437 Song Sparrow Dr
- 4441 Song Sparrow Dr
- 4441 Song Sparrow Dr Unit 186
- 4425 Song Sparrow Dr Unit 182
- 4425 Song Sparrow Dr
- 4436 Song Sparrow Dr
- 4436 Song Sparrow Dr Unit 250
- 4430 Song Sparrow Dr Unit 249
- 4430 Song Sparrow Dr
- 4421 Song Sparrow Dr
- 4216 Caribbean Pine Ct
- 4445 Song Sparrow Dr
- 4445 Song Sparrow Dr Unit 187
- 4442 Song Sparrow Dr Unit 251
- 4442 Song Sparrow Dr
- 4234 Caribbean Pine Ct
- 4420 Song Sparrow Dr