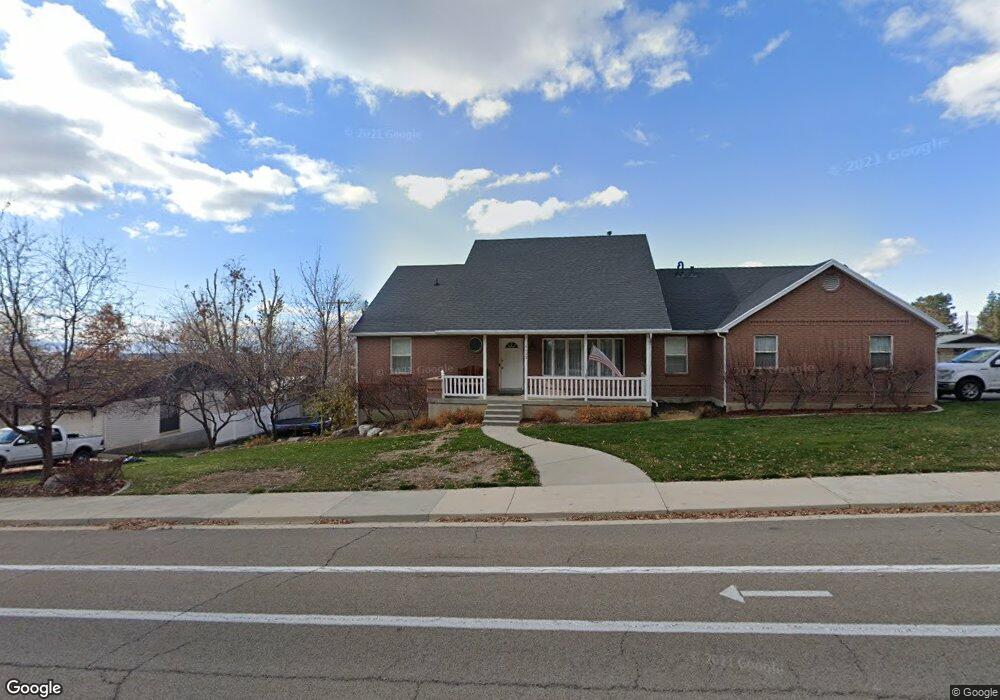
4433 Timpview Dr Provo, UT 84604
Rock Canyon NeighborhoodEstimated Value: $762,281 - $847,000
4
Beds
4
Baths
2,850
Sq Ft
$282/Sq Ft
Est. Value
About This Home
This home is located at 4433 Timpview Dr, Provo, UT 84604 and is currently estimated at $804,641, approximately $282 per square foot. 4433 Timpview Dr is a home located in Utah County with nearby schools including Canyon Crest Elementary School, Centennial Middle School, and Timpview High School.
Ownership History
Date
Name
Owned For
Owner Type
Purchase Details
Closed on
Apr 13, 2009
Sold by
Morgan James A and Morgan Sue S
Bought by
Morgan James A and Morgan Sue S
Current Estimated Value
Home Financials for this Owner
Home Financials are based on the most recent Mortgage that was taken out on this home.
Original Mortgage
$228,000
Interest Rate
5.17%
Mortgage Type
New Conventional
Purchase Details
Closed on
Mar 28, 2002
Sold by
Morgan James A and Morgan Sue S
Bought by
Morgan James A and Morgan Sue S
Home Financials for this Owner
Home Financials are based on the most recent Mortgage that was taken out on this home.
Original Mortgage
$35,000
Interest Rate
6.84%
Create a Home Valuation Report for This Property
The Home Valuation Report is an in-depth analysis detailing your home's value as well as a comparison with similar homes in the area
Home Values in the Area
Average Home Value in this Area
Purchase History
| Date | Buyer | Sale Price | Title Company |
|---|---|---|---|
| Morgan James A | -- | Integrated Title Insurance | |
| Morgan James A | -- | Integrated Title Insurance | |
| Morgan James A | -- | Access Title Company | |
| Morgan James A | -- | Access Title Company |
Source: Public Records
Mortgage History
| Date | Status | Borrower | Loan Amount |
|---|---|---|---|
| Closed | Morgan James A | $228,000 | |
| Closed | Morgan James A | $35,000 |
Source: Public Records
Tax History
| Year | Tax Paid | Tax Assessment Tax Assessment Total Assessment is a certain percentage of the fair market value that is determined by local assessors to be the total taxable value of land and additions on the property. | Land | Improvement |
|---|---|---|---|---|
| 2025 | $4,427 | $454,960 | -- | -- |
| 2024 | $4,427 | $435,765 | $0 | $0 |
| 2023 | $4,294 | $416,680 | $0 | $0 |
| 2022 | $4,086 | $399,850 | $0 | $0 |
| 2021 | $3,133 | $534,600 | $215,800 | $318,800 |
| 2020 | $3,077 | $492,300 | $179,800 | $312,500 |
| 2019 | $2,878 | $478,800 | $179,800 | $299,000 |
| 2018 | $2,765 | $466,600 | $167,600 | $299,000 |
| 2017 | $2,566 | $237,930 | $0 | $0 |
| 2016 | $2,718 | $234,905 | $0 | $0 |
| 2015 | $2,627 | $229,460 | $0 | $0 |
| 2014 | $2,428 | $221,100 | $0 | $0 |
Source: Public Records
Map
Nearby Homes
- 4601 Foothill Dr
- 645 Foothill Dr
- 4606 Brookshire Cir
- 4640 Brookshire Cir
- 981 Waterford Dr Unit 5&6
- 285 Three Fountains Dr
- 4299 Ivy Ln
- 299 E 4000 N
- 221 E 4735 N
- 407 E 3900 Rd N Unit 1
- 407 E 3900 Rd N
- 4612 N Bristol Cir
- 4529 Windsor Dr
- 1085 Windsor Dr
- 4277 N Imperial Way Unit 347
- 3711 N Canyon Rd
- 3702 N 920 E
- 4380 Stone Creek Ln
- 4006 Sherwood Dr
- 5005 N Edgewood Dr Unit 310
Your Personal Tour Guide
Ask me questions while you tour the home.