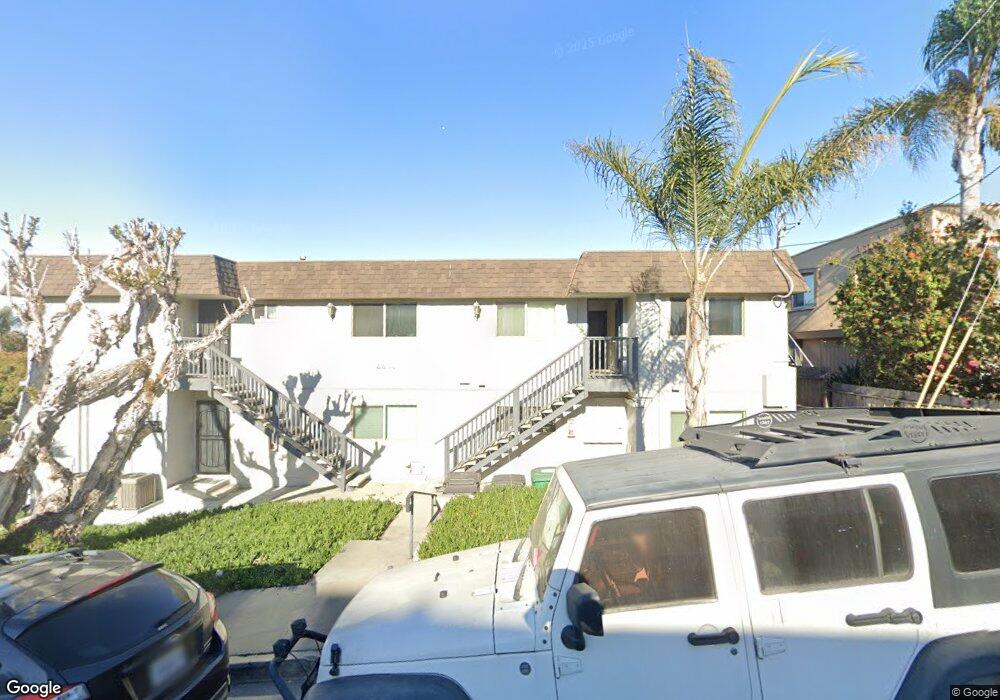
4434 Temecula St Unit 5 San Diego, CA 92107
Point Loma Heights NeighborhoodEstimated Value: $400,151 - $489,000
1
Bed
1
Bath
549
Sq Ft
$831/Sq Ft
Est. Value
About This Home
This home is located at 4434 Temecula St Unit 5, San Diego, CA 92107 and is currently estimated at $456,288, approximately $831 per square foot. 4434 Temecula St Unit 5 is a home located in San Diego County with nearby schools including Ocean Beach Elementary School, Richard Henry Dana Middle School, and Correia Middle School.
Ownership History
Date
Name
Owned For
Owner Type
Purchase Details
Closed on
Mar 26, 2021
Sold by
Zimmet Blake J
Bought by
Zimmet Blake and Zimmet Caroline
Current Estimated Value
Purchase Details
Closed on
Feb 21, 2015
Sold by
Zimmet Blake J and Toledo Caroline M
Bought by
Zimmet Blake J
Purchase Details
Closed on
Dec 7, 2009
Sold by
Chronowski Emily P
Bought by
Zimmet Blake J
Home Financials for this Owner
Home Financials are based on the most recent Mortgage that was taken out on this home.
Original Mortgage
$166,920
Outstanding Balance
$108,931
Interest Rate
4.91%
Mortgage Type
FHA
Estimated Equity
$347,357
Purchase Details
Closed on
Mar 28, 2006
Sold by
Chronowski Emily and Weikel Emily P
Bought by
Chronowski Emily P
Home Financials for this Owner
Home Financials are based on the most recent Mortgage that was taken out on this home.
Original Mortgage
$234,500
Interest Rate
6.25%
Mortgage Type
Stand Alone Refi Refinance Of Original Loan
Create a Home Valuation Report for This Property
The Home Valuation Report is an in-depth analysis detailing your home's value as well as a comparison with similar homes in the area
Home Values in the Area
Average Home Value in this Area
Purchase History
| Date | Buyer | Sale Price | Title Company |
|---|---|---|---|
| Zimmet Blake | -- | Lawyers Title Sd | |
| Zimmet Blake J | -- | None Available | |
| Zimmet Blake J | $170,000 | None Available | |
| Chronowski Emily P | -- | Fidelity National Title San |
Source: Public Records
Mortgage History
| Date | Status | Borrower | Loan Amount |
|---|---|---|---|
| Open | Zimmet Blake J | $166,920 | |
| Previous Owner | Chronowski Emily P | $234,500 |
Source: Public Records
Tax History Compared to Growth
Tax History
| Year | Tax Paid | Tax Assessment Tax Assessment Total Assessment is a certain percentage of the fair market value that is determined by local assessors to be the total taxable value of land and additions on the property. | Land | Improvement |
|---|---|---|---|---|
| 2025 | $2,674 | $219,422 | $161,344 | $58,078 |
| 2024 | $2,674 | $215,121 | $158,181 | $56,940 |
| 2023 | $2,615 | $210,904 | $155,080 | $55,824 |
| 2022 | $2,545 | $206,770 | $152,040 | $54,730 |
| 2021 | $2,528 | $202,716 | $149,059 | $53,657 |
| 2020 | $2,498 | $200,638 | $147,531 | $53,107 |
| 2019 | $2,454 | $196,705 | $144,639 | $52,066 |
| 2018 | $2,295 | $192,849 | $141,803 | $51,046 |
| 2017 | $2,241 | $189,069 | $139,023 | $50,046 |
| 2016 | $2,205 | $185,363 | $136,298 | $49,065 |
| 2015 | $2,090 | $182,579 | $134,251 | $48,328 |
| 2014 | $2,057 | $179,004 | $131,622 | $47,382 |
Source: Public Records
Map
Nearby Homes
- 4375 Temecula St Unit 77
- 4380 Temecula St Unit 4
- 4363 Temecula St
- 4377 Rialto St Unit 1, 2
- 4377 Rialto St
- 4377 Rialto St Unit 449-867-01-00
- 4368 Temecula St Unit 101
- 4444 W Point Loma Blvd Unit 23
- 4444 W Point Loma Blvd Unit 45
- 4494 Mentone St Unit 6
- 4337-39 Mentone St
- 4263 Mentone St Unit 65
- 3098 Rue Dorleans Unit 302
- 3098 Rue Dorleans Unit 331
- 3050 Rue D’orleans Unit 461
- 2658 Worden St Unit 223
- 3942 Valeta St Unit 256
- 2658 Worden St Unit 232
- 4012 Valeta St Unit 304
- 2640 Worden St Unit 207
- 4434 Temecula St Unit 6
- 4434 Temecula St Unit 4
- 4434 Temecula St Unit 3
- 4434 Temecula St Unit 2
- 4426 Temecula St Unit 7
- 4426 Temecula St Unit 6
- 4426 Temecula St Unit 5
- 4426 Temecula St Unit 4
- 4426 Temecula St Unit 3
- 4426 Temecula St Unit 2
- 4426 Temecula St Unit 1
- 4422 Temecula St
- 4418 Temecula St Unit 20
- 4433 Temecula St
- 4441 Temecula St
- 4425 Temecula St
- 4410 Temecula St
- 4447 Temecula St Unit 49
- 4415 Temecula St Unit 449-860-74-00
- 4415 Temecula St