Estimated Value: $123,609
--
Bed
--
Bath
2,000
Sq Ft
$62/Sq Ft
Est. Value
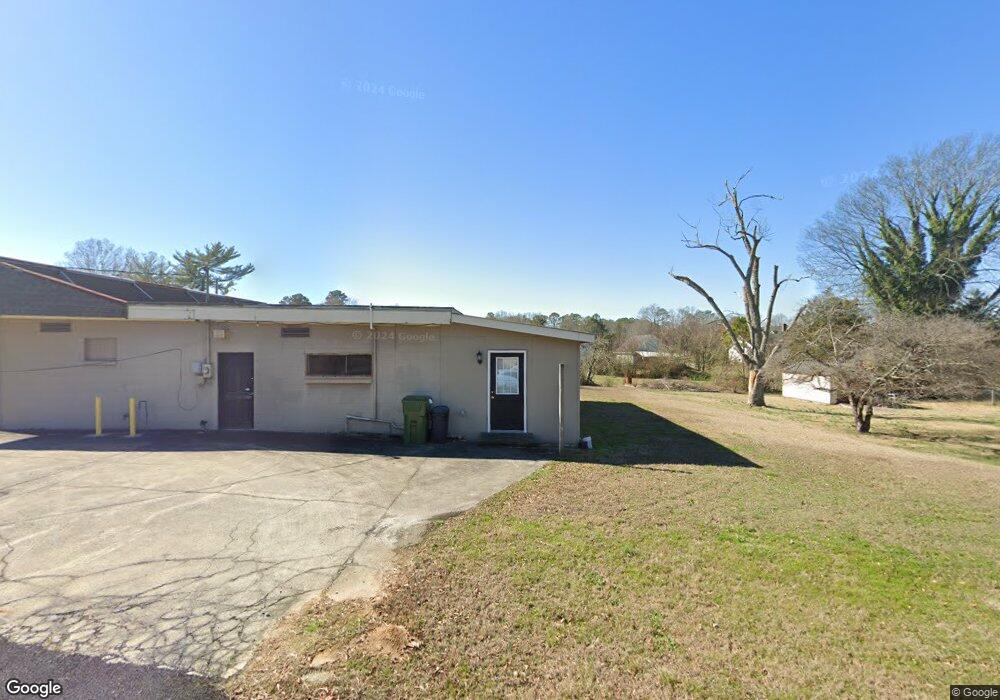
About This Home
This home is located at 4435 Old Calhoun Rd NE, Rome, GA 30161 and is currently estimated at $123,609, approximately $61 per square foot. 4435 Old Calhoun Rd NE is a home located in Floyd County with nearby schools including Model Middle School and Model High School.
Ownership History
Date
Name
Owned For
Owner Type
Purchase Details
Closed on
Oct 3, 2018
Sold by
Olivar Alberto
Bought by
Walls Jerry W
Current Estimated Value
Purchase Details
Closed on
Dec 21, 2016
Bought by
Olivar Aberto
Purchase Details
Closed on
Nov 5, 2013
Sold by
Heritage First Bank
Bought by
Heritage First Bank
Purchase Details
Closed on
Aug 14, 2007
Sold by
Not Provided
Bought by
Johnson William A
Home Financials for this Owner
Home Financials are based on the most recent Mortgage that was taken out on this home.
Original Mortgage
$102,056
Interest Rate
6.7%
Mortgage Type
Commercial
Purchase Details
Closed on
Apr 21, 2003
Sold by
Dawson Harry E
Bought by
York Teresa
Purchase Details
Closed on
Mar 4, 1981
Sold by
Neal Clarence L and Neal Marie
Bought by
Dawson Harry E
Purchase Details
Closed on
Aug 2, 1967
Sold by
Spiva Clyde
Bought by
Neal Clarence L and Neal Marie
Purchase Details
Closed on
Dec 1, 1964
Bought by
Spiva Clyde
Create a Home Valuation Report for This Property
The Home Valuation Report is an in-depth analysis detailing your home's value as well as a comparison with similar homes in the area
Home Values in the Area
Average Home Value in this Area
Purchase History
| Date | Buyer | Sale Price | Title Company |
|---|---|---|---|
| Walls Jerry W | $52,000 | -- | |
| Olivar Aberto | $43,450 | -- | |
| Heritage First Bank | -- | -- | |
| Johnson William A | $100,000 | -- | |
| York Teresa | $88,000 | -- | |
| Dawson Harry E | $30,000 | -- | |
| Neal Clarence L | $12,000 | -- | |
| Spiva Clyde | -- | -- |
Source: Public Records
Mortgage History
| Date | Status | Borrower | Loan Amount |
|---|---|---|---|
| Previous Owner | Johnson William A | $102,056 |
Source: Public Records
Tax History Compared to Growth
Tax History
| Year | Tax Paid | Tax Assessment Tax Assessment Total Assessment is a certain percentage of the fair market value that is determined by local assessors to be the total taxable value of land and additions on the property. | Land | Improvement |
|---|---|---|---|---|
| 2024 | $1,901 | $66,378 | $7,216 | $59,162 |
| 2023 | $1,899 | $54,690 | $6,560 | $48,130 |
| 2022 | $1,497 | $50,464 | $5,360 | $45,104 |
| 2021 | $1,376 | $45,578 | $4,884 | $40,694 |
| 2020 | $1,368 | $44,963 | $4,247 | $40,716 |
| 2019 | $625 | $42,372 | $4,247 | $38,125 |
| 2018 | $1,158 | $38,500 | $4,045 | $34,455 |
| 2017 | $524 | $38,704 | $3,746 | $34,958 |
| 2016 | $1,196 | $39,180 | $3,720 | $35,460 |
| 2015 | -- | $39,180 | $3,720 | $35,460 |
| 2014 | -- | $39,180 | $3,720 | $35,460 |
Source: Public Records
Map
Nearby Homes
- 16 Cinnamon Ln NE
- 7 Thrushwood Rd NE
- 00 Todd St NE
- 1055 E Hermitage Rd NE
- 320 Old Shannon Rd NE
- 814 Shannon Cir NE
- 4th Shannon Cir NE
- 535 1st St NE
- 841 Shannon Cir NE
- 255 E 2nd St NE
- 6 Keystone Ln NE
- 129 Pierce Hill Rd NE
- 430 Third St
- 635 E 3rd St
- 320 Shannon Rd NE
- 59 Round Rock Cir NE
- 50 Round Rock Cir NE
- 1225 Rush Chapel Rd NE
- 56 Lull Rd NE
- 0 Flowery Branch Rd Unit 7684237
- 4435 Old Calhoun Rd
- 21 Henton Rd NE
- 8 Henton Rd NE
- 4420 Calhoun Hwy NE
- 4420 Calhoun Rd NE
- 4406 Calhoun Rd
- 4449 Calhoun Rd NE
- 4391 Calhoun Rd NE
- 4406 Calhoun Rd NE
- 4449 Calhoun Hwy NE
- 4436 Calhoun Rd NE
- 26 Joy Huf Dr
- 4450 Calhoun Rd NE
- 42 Henton Rd NE
- 4458 Calhoun Rd NE
- 4462 Calhoun Rd NE
- 4382 Calhoun Rd NE
- 4382 Calhoun Hwy NE
- 195 Old Calhoun Rd NE
- 169 Old Calhoun Rd NE