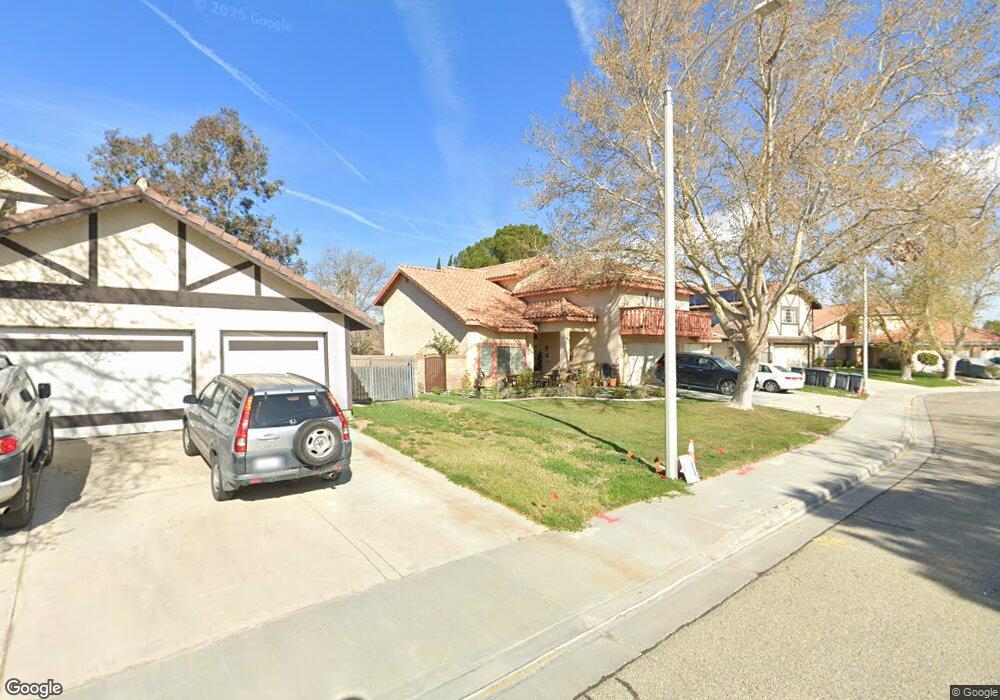
44353 Nolina Cir Lancaster, CA 93536
West Lancaster NeighborhoodEstimated Value: $545,000 - $552,000
4
Beds
3
Baths
2,417
Sq Ft
$228/Sq Ft
Est. Value
About This Home
This home is located at 44353 Nolina Cir, Lancaster, CA 93536 and is currently estimated at $549,905, approximately $227 per square foot. 44353 Nolina Cir is a home located in Los Angeles County with nearby schools including West Wind Elementary School, Amargosa Creek Middle School, and Lancaster High School.
Ownership History
Date
Name
Owned For
Owner Type
Purchase Details
Closed on
Aug 3, 1997
Sold by
Fountainwood Agoura
Bought by
Frise Daniel P and Frise Anna P
Current Estimated Value
Home Financials for this Owner
Home Financials are based on the most recent Mortgage that was taken out on this home.
Original Mortgage
$139,060
Outstanding Balance
$20,972
Interest Rate
7.61%
Mortgage Type
FHA
Estimated Equity
$528,933
Create a Home Valuation Report for This Property
The Home Valuation Report is an in-depth analysis detailing your home's value as well as a comparison with similar homes in the area
Home Values in the Area
Average Home Value in this Area
Purchase History
| Date | Buyer | Sale Price | Title Company |
|---|---|---|---|
| Frise Daniel P | $141,000 | Chicago Title |
Source: Public Records
Mortgage History
| Date | Status | Borrower | Loan Amount |
|---|---|---|---|
| Open | Frise Daniel P | $139,060 |
Source: Public Records
Tax History
| Year | Tax Paid | Tax Assessment Tax Assessment Total Assessment is a certain percentage of the fair market value that is determined by local assessors to be the total taxable value of land and additions on the property. | Land | Improvement |
|---|---|---|---|---|
| 2025 | $4,134 | $228,366 | $45,012 | $183,354 |
| 2024 | $4,134 | $223,889 | $44,130 | $179,759 |
| 2023 | $4,049 | $219,500 | $43,265 | $176,235 |
| 2022 | $3,845 | $215,197 | $42,417 | $172,780 |
| 2021 | $3,444 | $210,979 | $41,586 | $169,393 |
| 2019 | $3,348 | $204,723 | $40,353 | $164,370 |
| 2018 | $3,290 | $200,710 | $39,562 | $161,148 |
| 2016 | $3,109 | $192,919 | $38,027 | $154,892 |
| 2015 | $3,070 | $190,022 | $37,456 | $152,566 |
| 2014 | $3,051 | $186,301 | $36,723 | $149,578 |
Source: Public Records
Map
Nearby Homes
- 44273 Palo Verde St
- 4019 W Avenue J
- 0 40th St W Unit SR25272825
- 0 40th St W Unit PW24197213
- 0 40th St W Unit OC25055748
- 0 40th St W Unit SR25272817
- 0 40th St W Unit 25008921
- 0 40th St W Unit 25008920
- 44235 Westridge Dr
- 3714 Pondera St
- 44137 37th St W
- 44128 Westridge Dr
- 44047 Colony Ct
- 3630 Pillsbury St
- 40th Street W
- 44302 Marbella St
- 3812 Jonathon Ct
- 3525 W Avenue j3
- 4019 W Avenue j9
- 43rd W Newgrove St
- 44345 Nolina Cir
- 44361 Nolina Cir
- 44312 Sedona Way
- 44320 Sedona Way
- 44337 Nolina Cir
- 44304 Sedona Way
- 3826 Nolina Cir
- 44328 Sedona Way
- 44344 Nolina Cir
- 3829 Nolina Cir
- 44238 Sedona Way
- 44336 Sedona Way
- 44329 Nolina Cir
- 3816 Nolina Cir
- 3821 Nolina Cir
- 3864 W Avenue J
- 3838 W Avenue J
- 44230 Sedona Way
- 44317 Sedona Way
- 44311 Sedona Way
Your Personal Tour Guide
Ask me questions while you tour the home.