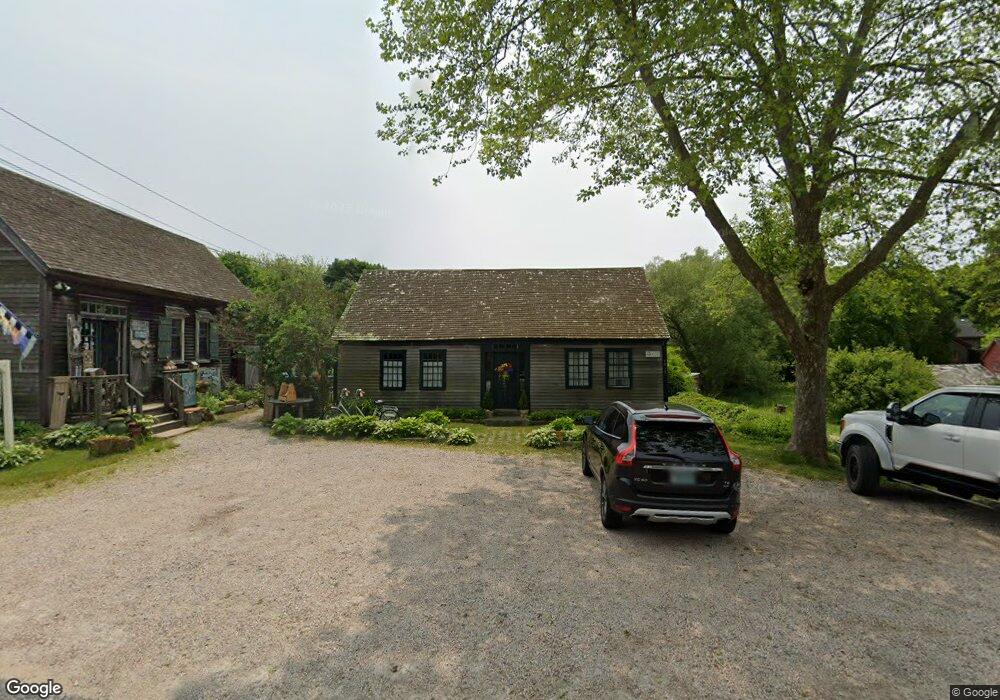
4436 Old Post Rd Charlestown, RI 02813
Estimated Value: $921,472
--
Bed
--
Bath
2,090
Sq Ft
$441/Sq Ft
Est. Value
About This Home
This home is located at 4436 Old Post Rd, Charlestown, RI 02813 and is currently estimated at $921,472, approximately $440 per square foot. 4436 Old Post Rd is a home located in Washington County with nearby schools including Chariho Regional Middle School and Chariho High School.
Ownership History
Date
Name
Owned For
Owner Type
Purchase Details
Closed on
Dec 1, 2006
Sold by
Applegat Kathy and Applegat William
Bought by
Bussey Kate A
Current Estimated Value
Home Financials for this Owner
Home Financials are based on the most recent Mortgage that was taken out on this home.
Original Mortgage
$378,200
Outstanding Balance
$226,744
Interest Rate
6.36%
Mortgage Type
Commercial
Estimated Equity
$694,728
Purchase Details
Closed on
Oct 27, 2003
Sold by
Kosmark John J and Kosmark Rebecca B
Bought by
Applegate William M and Applegate Kathy B
Purchase Details
Closed on
Dec 29, 1997
Sold by
Fazzone Anthony J and Fazzone Sally
Bought by
Reynolds Albert E and Lavoie Richard T
Home Financials for this Owner
Home Financials are based on the most recent Mortgage that was taken out on this home.
Original Mortgage
$130,400
Interest Rate
7.15%
Mortgage Type
Commercial
Create a Home Valuation Report for This Property
The Home Valuation Report is an in-depth analysis detailing your home's value as well as a comparison with similar homes in the area
Home Values in the Area
Average Home Value in this Area
Purchase History
| Date | Buyer | Sale Price | Title Company |
|---|---|---|---|
| Bussey Kate A | $455,000 | -- | |
| Bussey Kate A | $455,000 | -- | |
| Applegate William M | $430,000 | -- | |
| Applegate William M | $430,000 | -- | |
| Reynolds Albert E | $145,000 | -- | |
| Reynolds Albert E | $145,000 | -- |
Source: Public Records
Mortgage History
| Date | Status | Borrower | Loan Amount |
|---|---|---|---|
| Open | Reynolds Albert E | $378,200 | |
| Closed | Reynolds Albert E | $378,200 | |
| Previous Owner | Reynolds Albert E | $130,400 |
Source: Public Records
Tax History Compared to Growth
Tax History
| Year | Tax Paid | Tax Assessment Tax Assessment Total Assessment is a certain percentage of the fair market value that is determined by local assessors to be the total taxable value of land and additions on the property. | Land | Improvement |
|---|---|---|---|---|
| 2025 | $2,657 | $448,000 | $175,600 | $272,400 |
| 2024 | $2,589 | $448,000 | $175,600 | $272,400 |
| 2023 | $2,572 | $448,000 | $175,600 | $272,400 |
| 2022 | $3,078 | $376,700 | $178,300 | $198,400 |
| 2021 | $3,081 | $376,700 | $178,300 | $198,400 |
| 2020 | $3,100 | $376,700 | $178,300 | $198,400 |
| 2019 | $3,133 | $339,400 | $178,300 | $161,100 |
| 2018 | $3,272 | $339,400 | $178,300 | $161,100 |
| 2017 | $3,255 | $339,400 | $178,300 | $161,100 |
| 2016 | $3,493 | $342,100 | $178,300 | $163,800 |
| 2015 | $3,459 | $342,100 | $178,300 | $163,800 |
| 2014 | $3,387 | $342,100 | $178,300 | $163,800 |
Source: Public Records
Map
Nearby Homes
- 4459 Old Post Rd
- 49 West Way
- 19 W Spruce St
- 4960 S County Trail
- 0 Falcone Ln
- 14 Lakeside Dr
- 16 Center St
- 21 Browning Dr
- 130 Pequot Dr
- 4772 Old Post Rd
- 130 S Niantic Dr
- 350 Narrow Ln
- 150 Southern Way
- 45 Elizabeth Cooper Dr
- 15 Charlestown Rd
- 14 Charlestown Rd
- 19 Traymore St
- 15 Josephine Dr
- 23 Mohawk Trail
- 10 Josephine Dr Unit 2D
- 10 Town Dock Rd
- 4433 Old Post Rd Unit 4435
- 4435 Old Post Rd
- 4414 Old Post Rd
- 4437 Old Post Rd
- 20 Town Dock Rd
- 4412 Old Post Rd
- 30A Town Dock Rd
- 30 Town Dock Rd Unit A
- 29 Town Dock Rd
- 40 Town Dock Rd
- 4470 Old Post Rd
- 0 E Arnolda Dr
- 119 E Arnolda Dr
- 50 Town Dock Rd
- 11 E Arnolda Dr
- 47 Mill Brook Ct
- 4469 Old Post Rd
- 4490 Old Post Rd
- 14 Mill Brook Ct