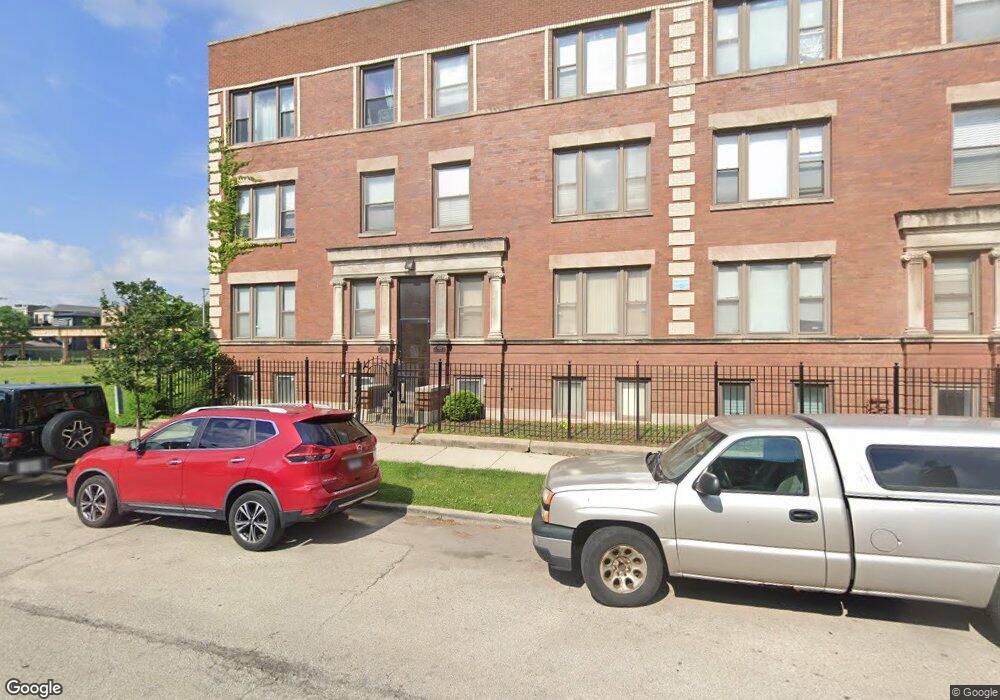
4436 S Calumet Ave Unit 2 Chicago, IL 60653
Grand Boulevard NeighborhoodEstimated Value: $182,000 - $249,000
2
Beds
2
Baths
1,200
Sq Ft
$184/Sq Ft
Est. Value
About This Home
This home is located at 4436 S Calumet Ave Unit 2, Chicago, IL 60653 and is currently estimated at $220,696, approximately $183 per square foot. 4436 S Calumet Ave Unit 2 is a home located in Cook County with nearby schools including Mollison Elementary School, Wendell Phillips Academy High School, and UChicago Charter Carter G. Woodson Campus.
Ownership History
Date
Name
Owned For
Owner Type
Purchase Details
Closed on
Mar 20, 2007
Sold by
Mortgage Guaranty Insurance Corp
Bought by
Starks Sheryl M
Current Estimated Value
Home Financials for this Owner
Home Financials are based on the most recent Mortgage that was taken out on this home.
Original Mortgage
$172,660
Outstanding Balance
$104,451
Interest Rate
6.25%
Mortgage Type
Purchase Money Mortgage
Estimated Equity
$116,245
Purchase Details
Closed on
Feb 2, 2006
Sold by
Aurora Loan Services Llc
Bought by
Mortgage Guaranty Insurance Corp
Home Financials for this Owner
Home Financials are based on the most recent Mortgage that was taken out on this home.
Original Mortgage
$172,660
Interest Rate
6.25%
Mortgage Type
Purchase Money Mortgage
Purchase Details
Closed on
Oct 31, 2002
Sold by
Cosmopolitan Bank & Trust
Bought by
Williams Marguerite D
Home Financials for this Owner
Home Financials are based on the most recent Mortgage that was taken out on this home.
Original Mortgage
$163,400
Interest Rate
6.25%
Create a Home Valuation Report for This Property
The Home Valuation Report is an in-depth analysis detailing your home's value as well as a comparison with similar homes in the area
Home Values in the Area
Average Home Value in this Area
Purchase History
| Date | Buyer | Sale Price | Title Company |
|---|---|---|---|
| Starks Sheryl M | $207,000 | Ticor Title | |
| Mortgage Guaranty Insurance Corp | $178,000 | Ticor Title | |
| Williams Marguerite D | $172,000 | -- |
Source: Public Records
Mortgage History
| Date | Status | Borrower | Loan Amount |
|---|---|---|---|
| Open | Starks Sheryl M | $172,660 | |
| Previous Owner | Mortgage Guaranty Insurance Corp | $172,660 | |
| Previous Owner | Williams Marguerite D | $163,400 |
Source: Public Records
Tax History Compared to Growth
Tax History
| Year | Tax Paid | Tax Assessment Tax Assessment Total Assessment is a certain percentage of the fair market value that is determined by local assessors to be the total taxable value of land and additions on the property. | Land | Improvement |
|---|---|---|---|---|
| 2024 | $3,320 | $20,400 | $3,019 | $17,381 |
| 2023 | $3,214 | $19,000 | $3,019 | $15,981 |
| 2022 | $3,214 | $19,000 | $3,019 | $15,981 |
| 2021 | $3,160 | $18,999 | $3,018 | $15,981 |
| 2020 | $1,026 | $7,709 | $1,466 | $6,243 |
| 2019 | $1,019 | $8,500 | $1,466 | $7,034 |
| 2018 | $1,000 | $8,500 | $1,466 | $7,034 |
| 2017 | $1,020 | $8,113 | $1,207 | $6,906 |
| 2016 | $1,125 | $8,113 | $1,207 | $6,906 |
| 2015 | $1,006 | $8,113 | $1,207 | $6,906 |
| 2014 | $1,478 | $10,535 | $1,035 | $9,500 |
| 2013 | $1,438 | $10,535 | $1,035 | $9,500 |
Source: Public Records
Map
Nearby Homes
- 4426 S Calumet Ave Unit G
- 4435 S Prairie Ave
- 4518 S King Dr Unit 2A
- 4441 S Indiana Ave Unit P7
- 4337 S Prairie Ave Unit G
- 4417 S Indiana Ave
- 212 E 44th St Unit 2
- 5847 S Prairie Ave
- 4358 S Prairie Ave
- 4530 S Prairie Ave Unit 1S
- 4543 S Prairie Ave Unit 3S
- 4540 S Prairie Ave
- 5900 S Calumet Ave
- 4447 S Michigan Ave
- 443 E 45th Place Unit 1
- 4551 S Michigan Ave Unit B
- 421 E 43rd St
- 4244 S Prairie Ave
- 4235 S Calumet Ave
- 4557 S Michigan Ave Unit 1
- 4436 S Calumet Ave Unit 4436G
- 4436 S Calumet Ave Unit 44363
- 4436 S Calumet Ave Unit 44362
- 4436 S Calumet Ave Unit 44361
- 4436 S Calumet Ave Unit 3
- 4436 S Calumet Ave Unit G
- 4432 S Calumet Ave Unit 3
- 4432 S Calumet Ave Unit 44323
- 4432 S Calumet Ave Unit 44321
- 4432 S Calumet Ave Unit 4432G
- 4432 S Calumet Ave Unit 44322
- 4454 S Calumet Ave
- 4438 S Calumet Ave Unit 2
- 4438 S Calumet Ave Unit 44383
- 4438 S Calumet Ave Unit 4438G
- 4438 S Calumet Ave Unit 44382
- 4438 S Calumet Ave Unit 44381
- 4438 S Calumet Ave Unit G
- 4438 S Calumet Ave Unit 3
- 4456 S Calumet Ave